Products You May Like
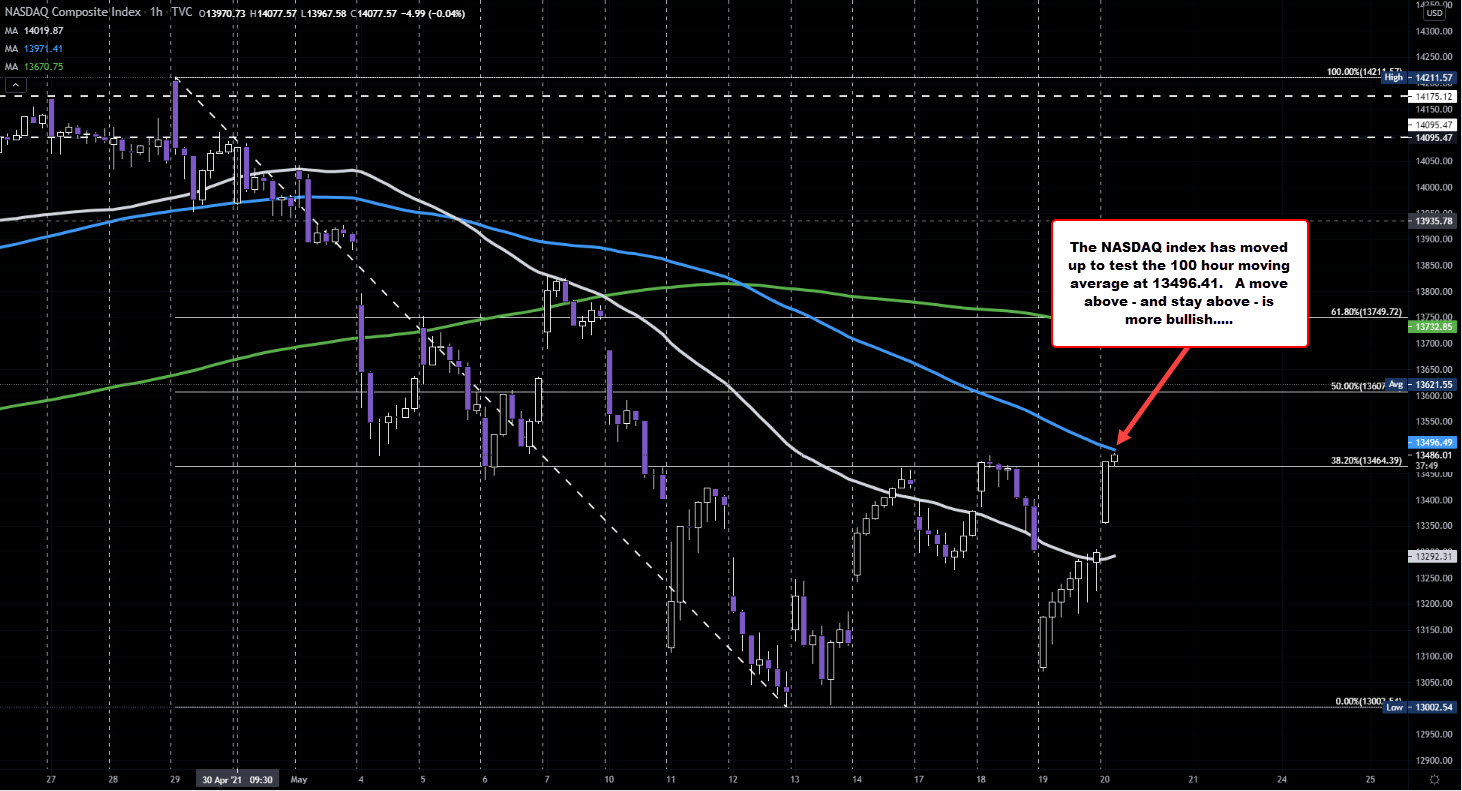
100 hour moving average above at 13496.41 (and moving lower)
The NASDAQ index is up around 187 points or 1.41% at 13486.74. The high price just reached 13489.44. The the price is now above the highs from yesterday (and the week).
Technically, the pair is moving up to a key resistance target against its 100 hour moving average (blue line in the chart above). That moving average comes in at 13496.41. The high price today got within around seven point of that level so far. It will take a move above that moving average (and stay above), to give the buyers more control.
Traders may also look to lean against the level (take profit or sell), as risk can be defined and limited against the level (with a stop on a break above).
The S&P index is up 32.2 points or 0.78% at 4147.87. The high reached 4148.78.
The Dow is up 150 points at 34046 (up 0.44%) and just off the high price of 34048.24. .

