Products You May Like
Below 200 hour MA. Above the 100 hour MA. Waits for the next shove
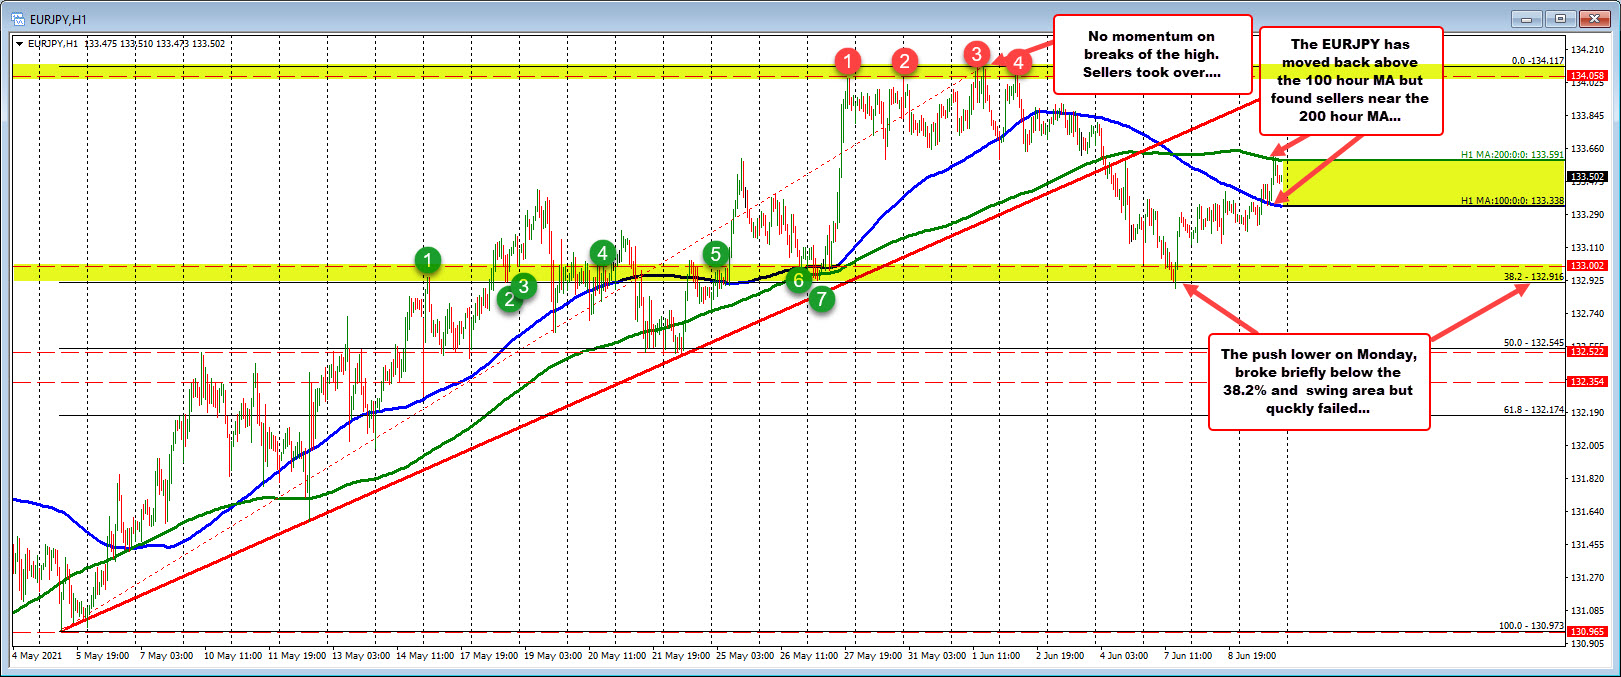
The EURJPY on the hourly chart below, peaked last week at 134.117 after taking out highs at 134.06 area, and failing to keep any sort of momentum going on the break.
The subsequent fall from the June 1 high to the price down toward the 38.2% retracement at 1.32916 along with a swing area between 1.3292 and 1.3300. The low price reached 1.3288 on Monday, and like the failed break at the highs, the failed break below the aforementioned technical levels, turned sellers in the buyers. The price has rotated higher over the last few days.
Today the falling 100 hour moving average at 133.338 was broken (blue line in the chart above). and the price moved up to test the 200 hour moving average (green line) currently at 133.591. Sellers leaned against that level, and the price has moved toward the mid range between the two moving averages.
From a technical perspective on the chart, the pair is at a neutral level, with buyers and sellers battling it out.
A break above the 200 hour moving average, would tilt the bias more to the upside. A move back toward the highs would be eyed by traders.
Conversely a break back below the 100 hour moving average (blue line), would be a tilt more in the downward direction. The 1.3300 level along with the swing area and 38.2% retracement would be eyed.

