Products You May Like
- DXY retreat from intraday high, holds onto Friday’s rebound from one-week low.
- Sustained trading above 100-SMA, monthly horizontal support keep buyers hopeful amid steady RSI.
- 50-SMA, weekly resistance line challenge short-term upside momentum.
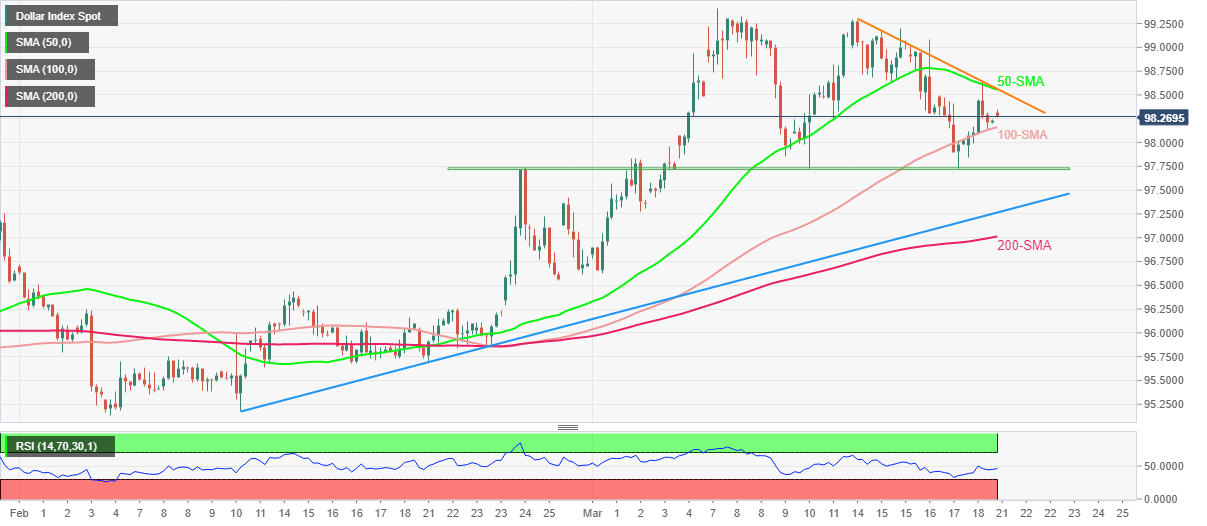
US Dollar Index (DXY) pares intraday gains around 98.30 during Monday’s Asian session. However, the greenback gauge keeps the last week’s U-turn from one-month-old horizontal support and the 100-SMA.
Given the steady RSI supporting the latest rebound from the aforementioned key supports, DXY is likely to remain firmer.
That said, a convergence of the 50-SMA and a descending trend line from March 14, near 98.55, becomes the key short-term hurdle for the US Dollar Index bulls to cross.
Following that, the 99.00 threshold will act as an intermediate halt during an upward trajectory towards the monthly peak of 99.41.
Meanwhile, the 100-SMA and a horizontal support area from late February, respectively around 98.15 and 97.70, act as tough nuts to crack for the DXY bears.
In a case where the quote drops below 97.70, the odds of its further fall towards an upward sloping trend line from February 10, near 97.25, can’t be ruled out. Though, the 200-SMA level of 97.00 can defend the bulls afterward.
DXY: Four-hour chart
Trend: Further upside expected


