Products You May Like
More selling in US stocks with the NASDAQ leading the way
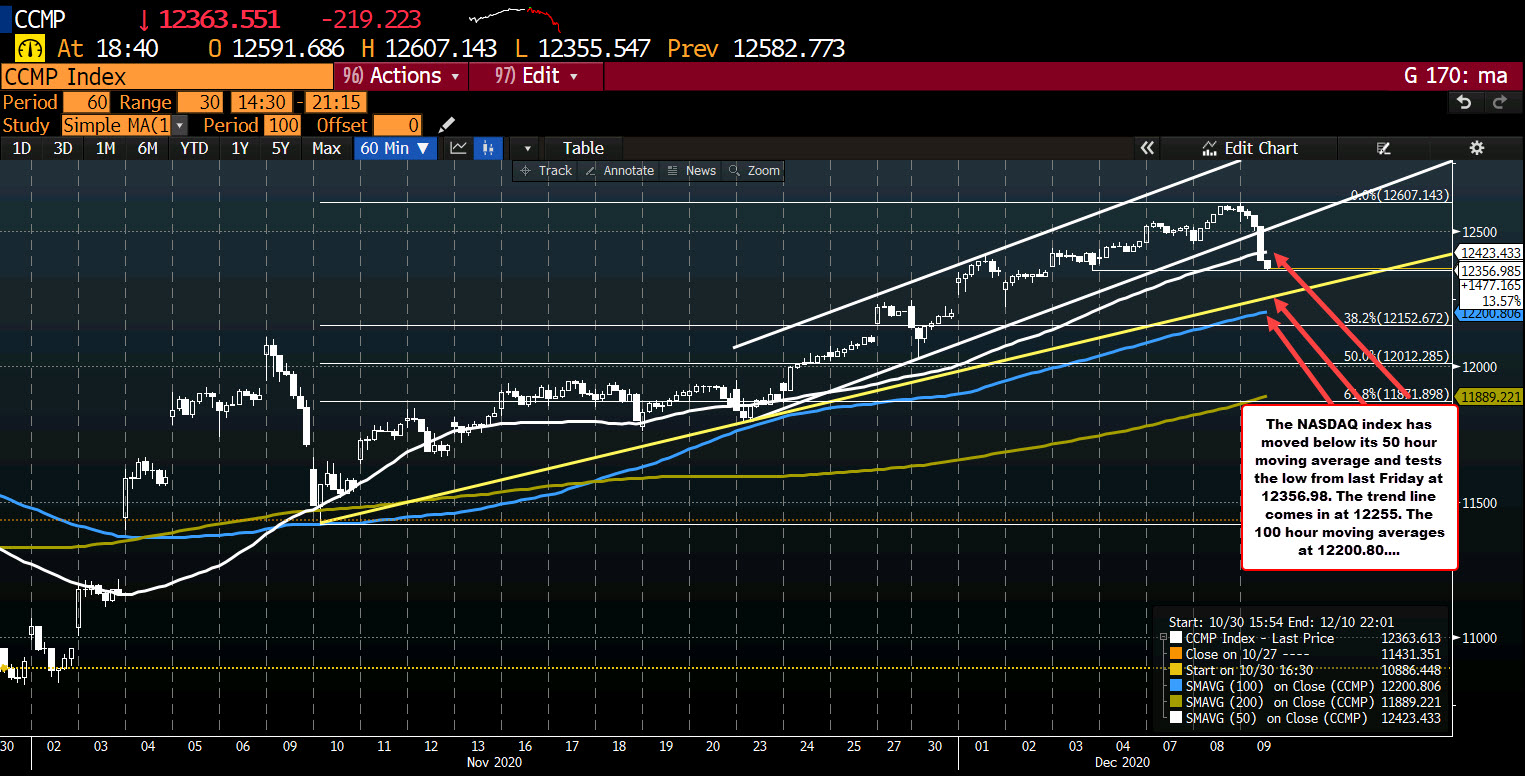
NASDAQ index falls below its 50 hour moving average for the 1st time since November 23. That moving average comes in at 12423.45. The current price is trading at 12364.723. The current price is testing the low from Friday’s trade at 12356.90. The low price just reached 12355.547.
Below that is an upward sloping trendline on the hourly chart at 12255 (and moving higher). The 100 hour moving averages at 12200.79 (and moving higher).
Looking at the daily chart, the NASDAQ index is coming off 3 straight record high closes. So some backtracking is not all that surprising.
The S&P index is ticking lower as well. It is currently down 30.8 points or -0.83% at 3671.32. The Dow is doing relatively better with a decline of 132 points or 0.44% at 30040.
Spot gold is trading down around $36 or -1.92% at $1834.60.
Spot silver is trading down $0.75 or -3.04% at $23.80
WTI crude oil futures are down $0.05 or -0.11% of $45.55

