Products You May Like
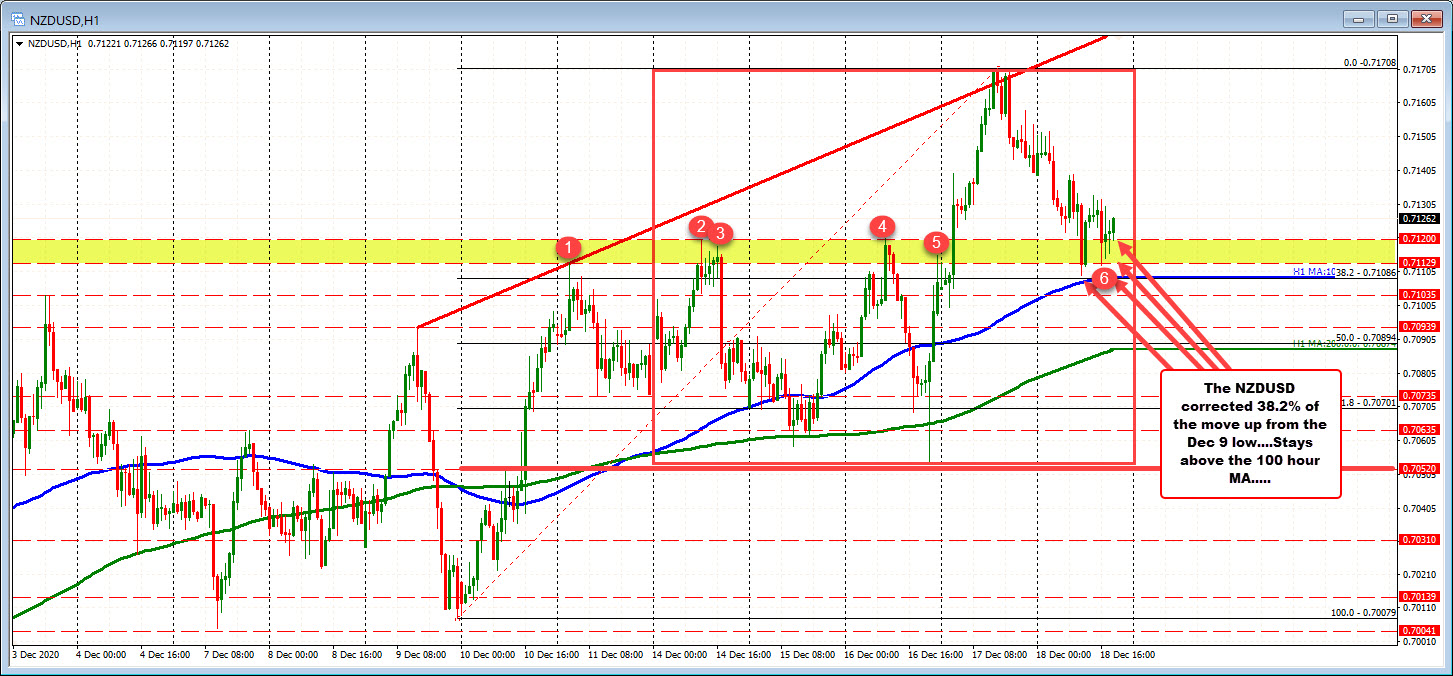
NZDUSD stalls ahead of 100 hour moving average and 38.2% retracement
The price of the NZDUSD spent the 1st 3 days of the trading finding resistance sellers against a swing area between 0.7112 and 0.7120 (see yellow area and red numbered circles). Meanwhile, the moves to the downside saw the price stall near support between 0.7053 and 0.7058.
After bottoming soon after the FOMC rate decision on Wednesday, the price extended above the resistance ceiling and ran to new session highs at 0.71708. Since then, the price has corrected lower. The move to the downside today, however, found support buyers against the 38.2% retracement of the move up from the December 9 low and also the rising 100 hour moving average. Both of those levels currently come in at 0.71086. The low price for the day reached 0.71094.
Since bottoming, the NZDUSD has waffled back and forth with most of the price staying above the old swing high area between 0.71129 at 0.7120.
Going forward (and into the new trading week). the 100 hour moving average and 38.2% retracement will be the key risk barometer for buyers and sellers. Stay above is more bullish. Move below is more bearish.
If the price can stay above those levels, rotation back toward the high for the week at 0.71708 is certainly not out of the question.
Move below the 100 hour moving average and traders will I the 50% retracement and rising 200 hour moving average currently around the 0.7089 area (for both). A move below both of those levels would increase the bearish bias for the pair.

