Products You May Like
Since the crash of March 2020, all stocks have tried to recover what they lost and Disney was no exception. Disney did not only recover the lost, but It also reached historic highs. Now, we are going to try to build an impulse from the March 2020 lows with a target around $230. Target measured from 0 to 2019’s high projected from March’s low, equal legs.
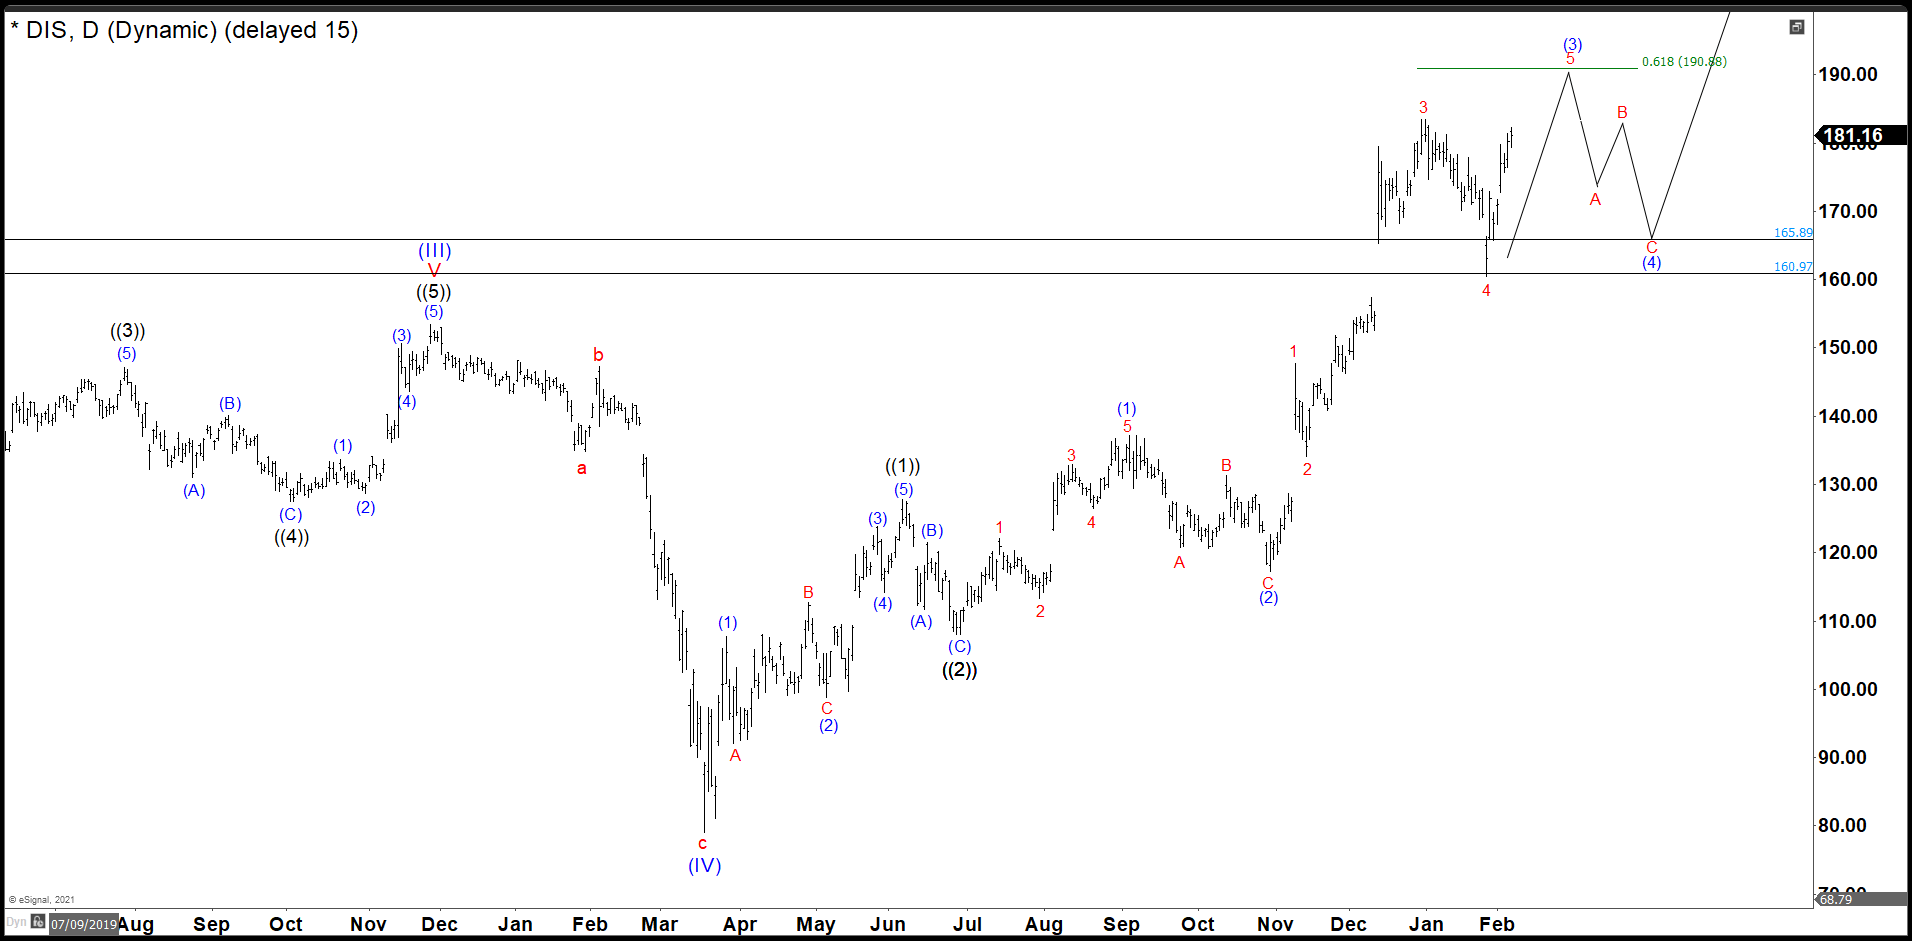
Disney Daily Chart
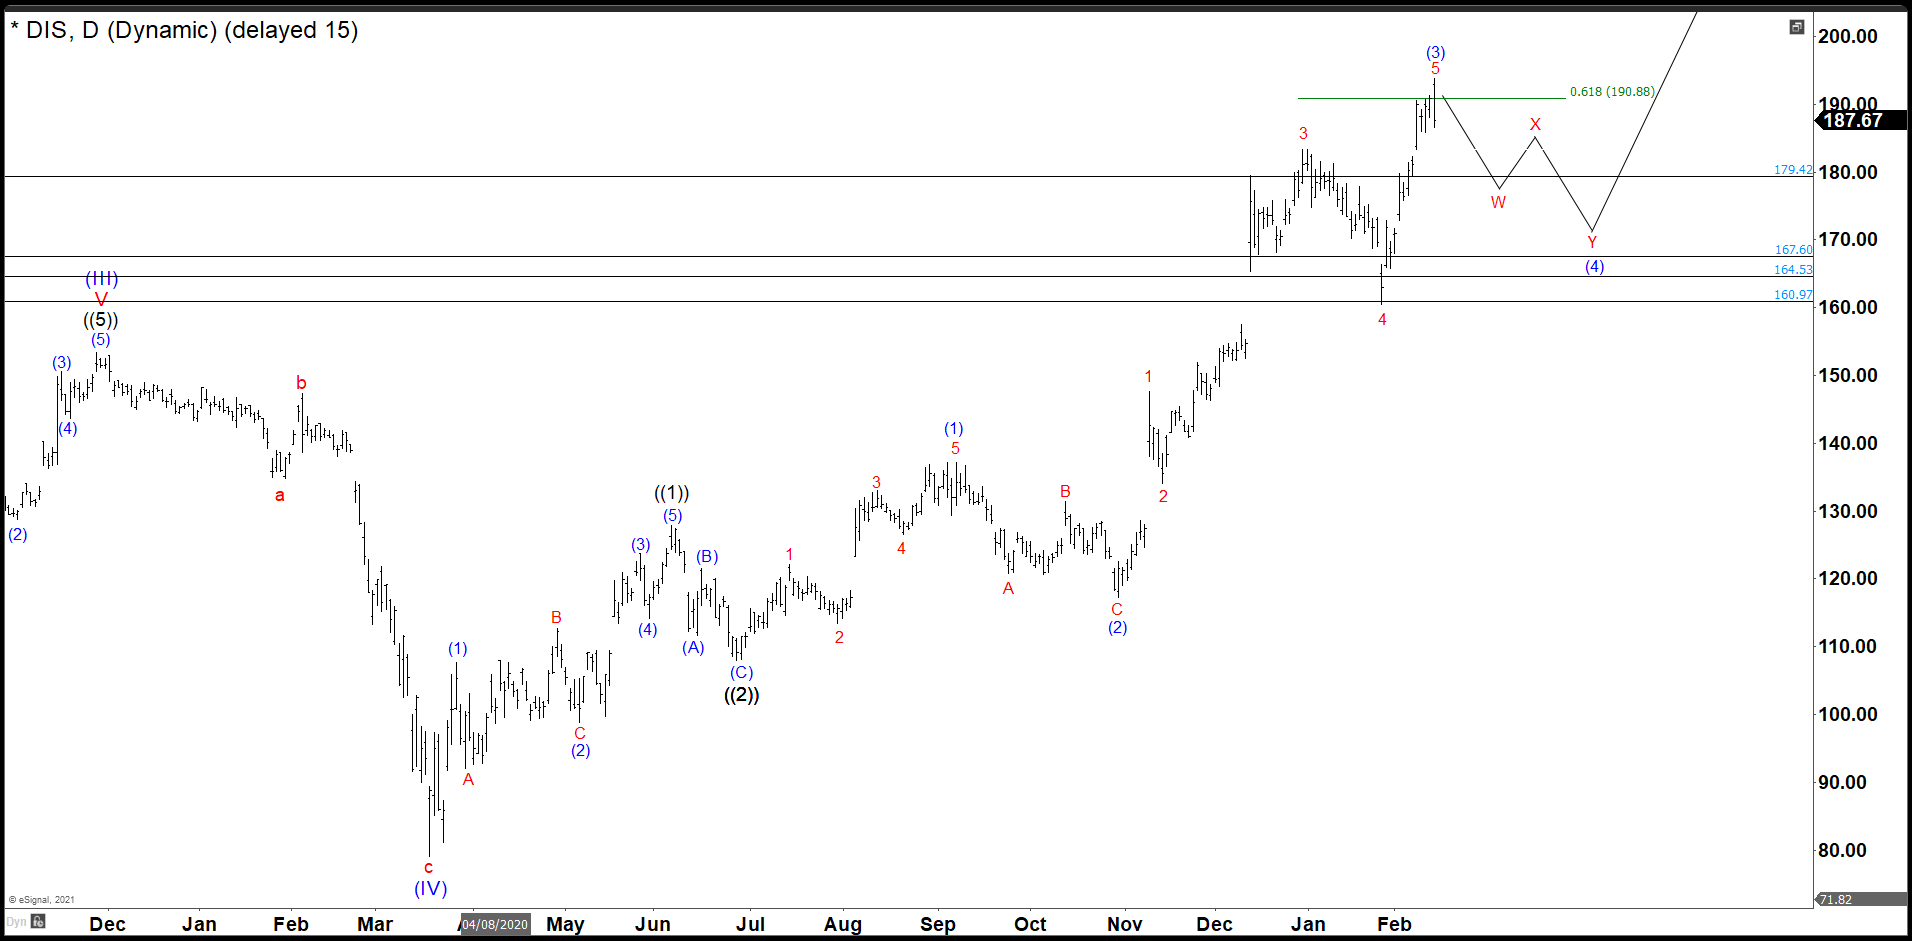
As we see in the daily chart, the waves ((1)) and ((2)) of the impulse have completed and currently we are building the wave ((3)). We believe that wave (3) of ((3)) is still developing and we need one more high to complete an impulse 1, 2, 3, 4, 5 in red. We expect that the wave 5 in red reaches 190.88, ideally, to end the structure of wave (3) of ((3)).
Last week we expected to continue higher as an impulse to complete the structure of the wave (3). On Monday the market broke to a new historical high and reached the first target at 190.88 after hours and continued higher to peak at 198.77. The target gave us a return of +18.58% from 160.97. We believe that 198.77 is the end of the wave (3) of ((3)) and wave (4) of ((3)) began to build. The area to watch to complete this wave (4) is between 179.42 –” 167.60 where we must continue the rally to find out a new historical high and complete the wave (5) of ((3)).
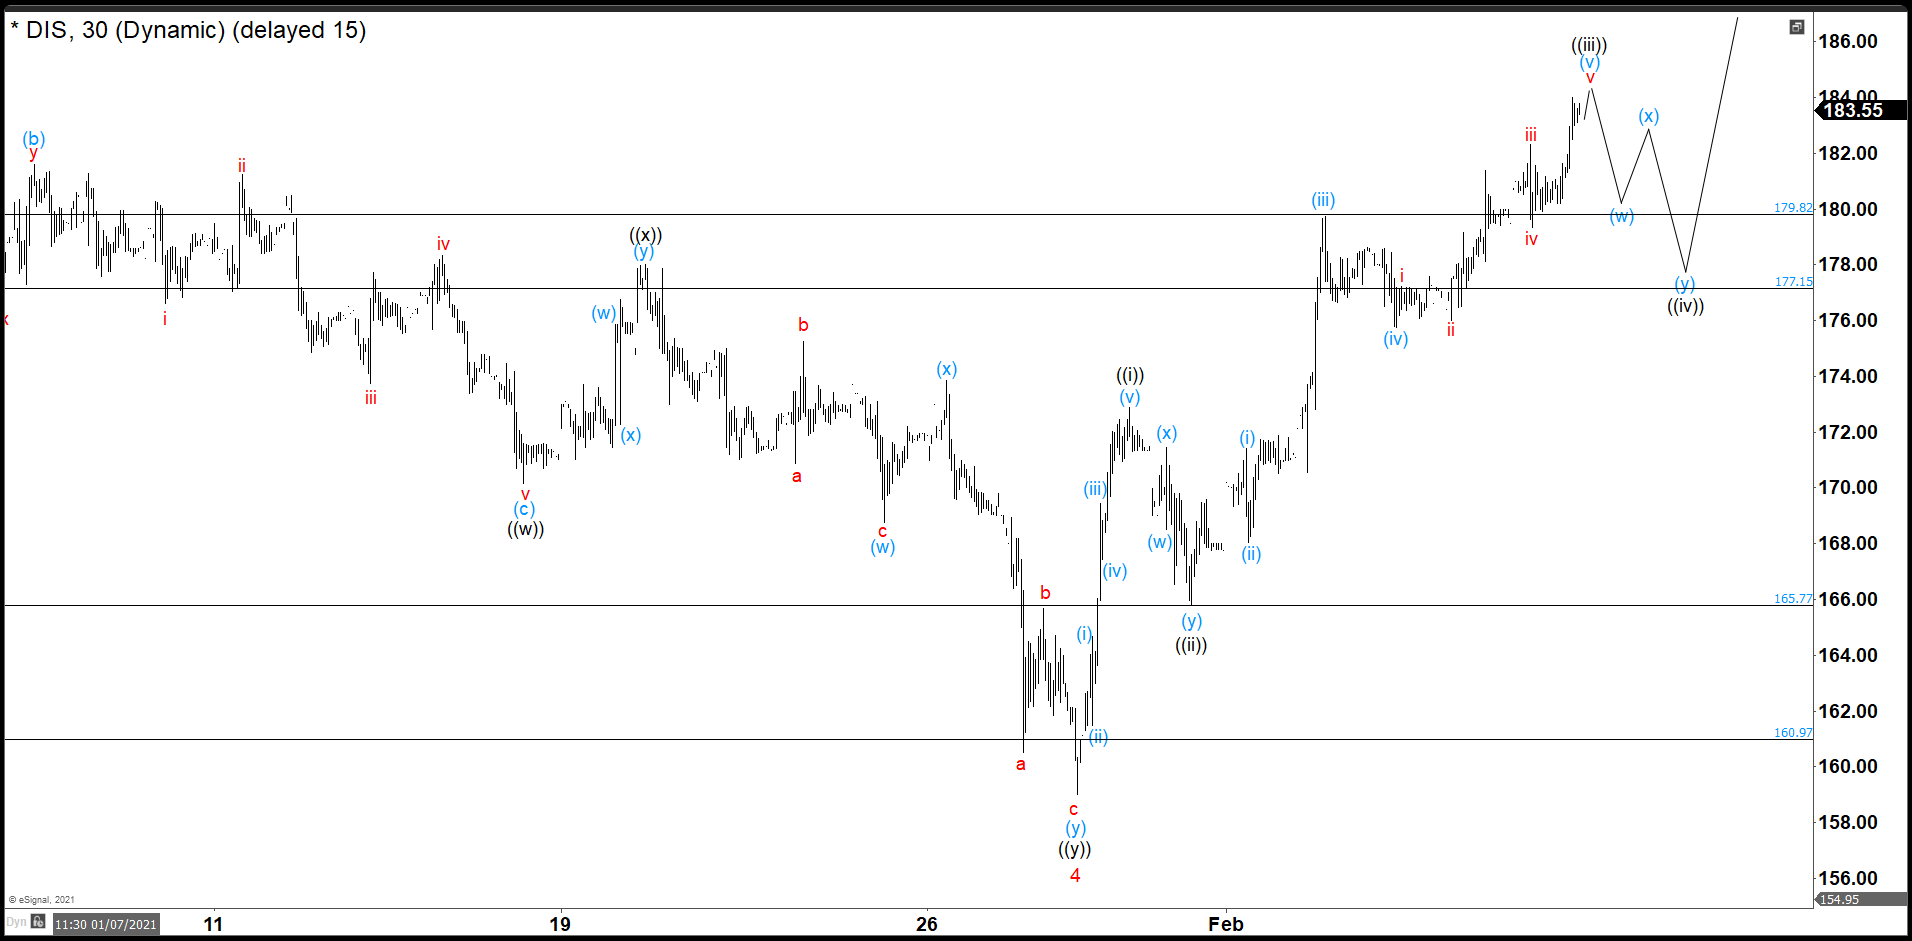
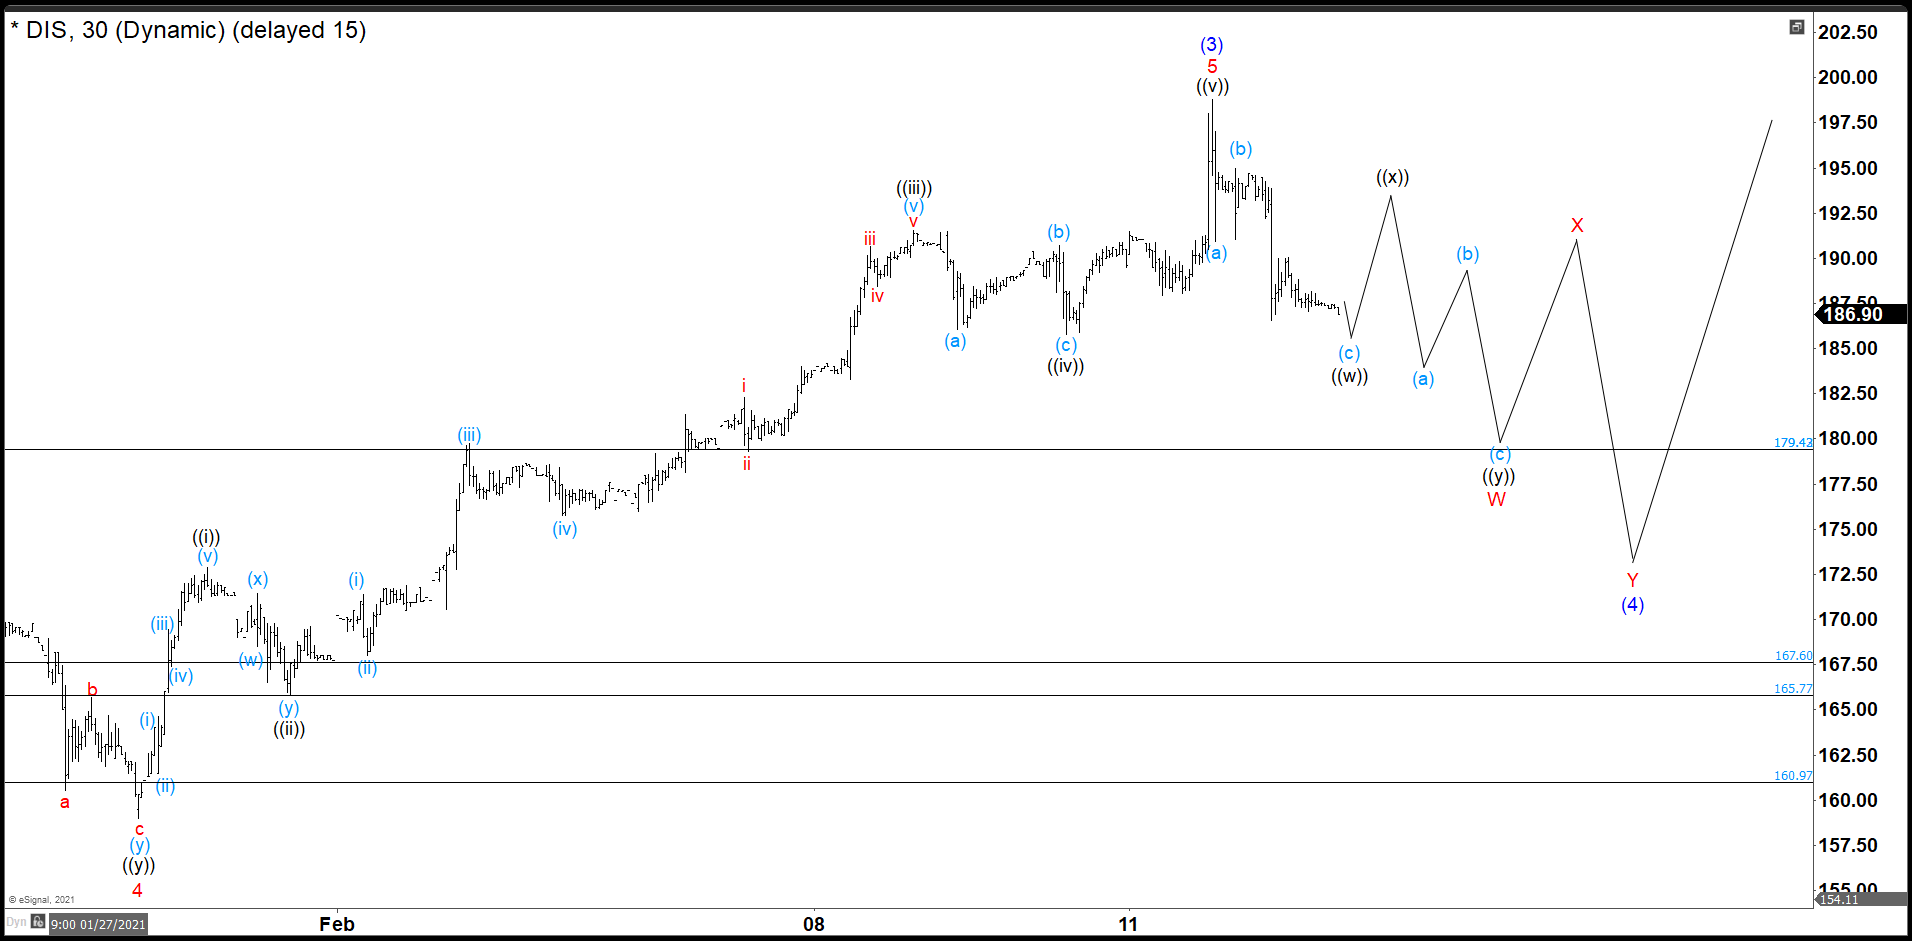
Disney 30 minutes Chart
In this chart, we expected a slightly high to complete an extended wave (v) and also wave ((iii)), but the market continues higher and extended even more until 191.54 where wave ((iii)) finished.
Then we corrected as a flat structure (a), (b), and (c) to end wave ((iv)) of 5, and finally rally to 198.77 to complete wave 5 of (3) and wave (3). From here, Disney began to drop and it should develop the wave (4). We already have seen 3 swings down and we expect get down a little more to complete ((w)). Then a corrective rally in other 3 swings to build ((x)) to continue the drop in the next week.

