Products You May Like
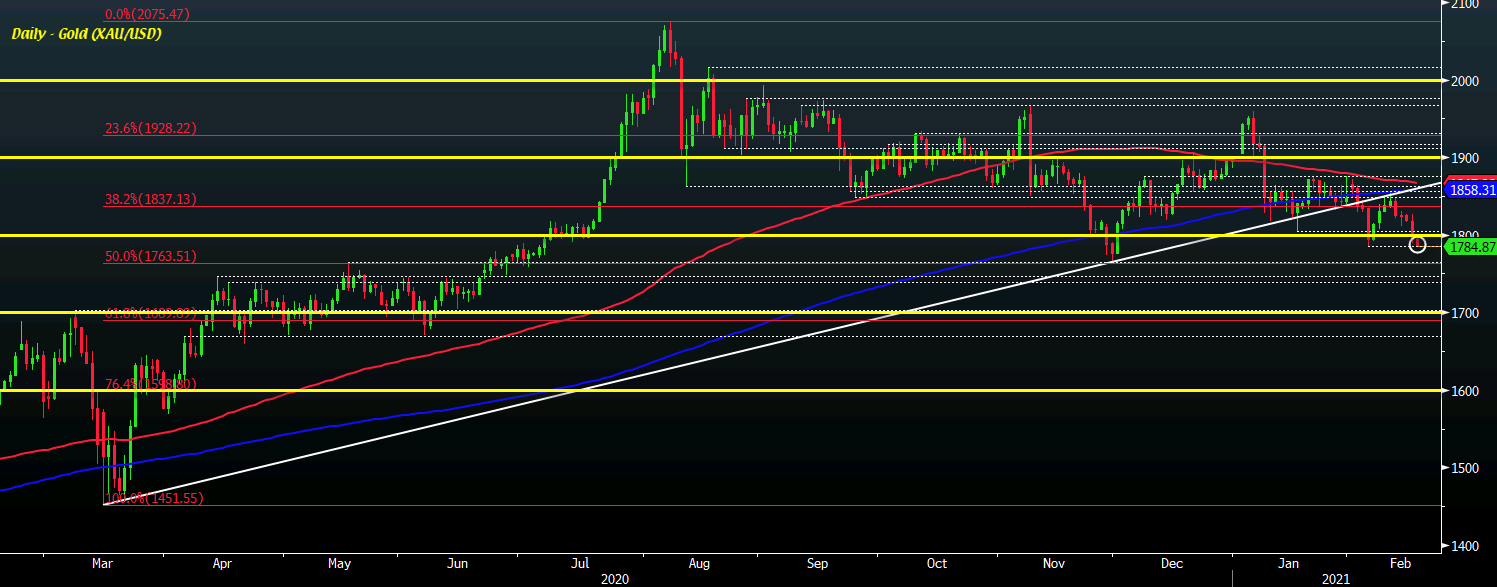
Gold falls to a low of $1,784.75, its lowest level since 1 December
The technical picture for gold has been looking rather iffy as of late and we are perhaps seeing the makings of another flush lower after failure to break above the 200-day moving average (blue line) in trading last week.
The shove lower sees gold on course for a fifth consecutive day of declines, falling back under $1,800 and testing support from the 4 February low @ $1,785 currently.
A break below that puts the focus back on the December low of $1,764.80 and that will be a serious make-or-break moment for gold if it is to hang on for the ride.
As things stand, buyers are slowly losing more momentum by the day and I’m not a big fan of how the technical picture is shaping up – despite being a firm advocate of the better fundamentals in gold in the bigger picture of things.
A looming death cross (100-day moving average crossing over below the 200-day moving average) also beckons, adding to signs that the upside momentum is waning.
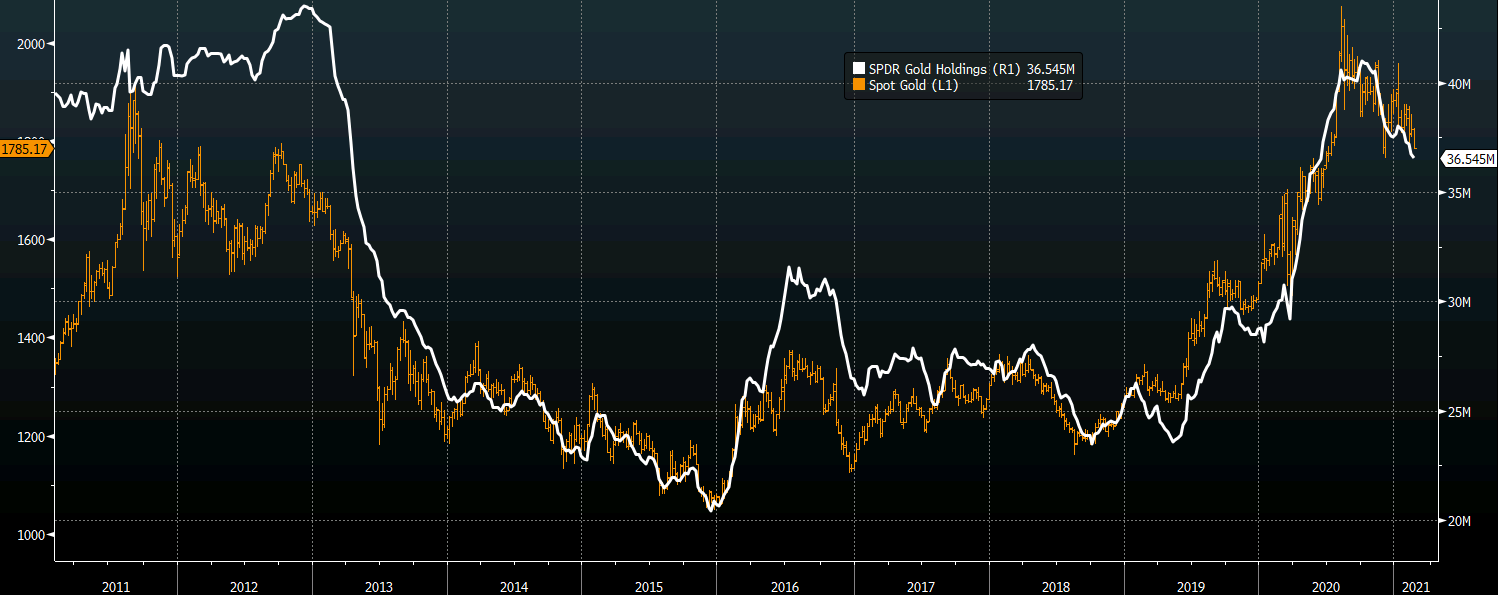
Meanwhile, ETF positions continue to be trimmed from extended levels and that could allude to further positioning adjustment before things stabilise in gold:

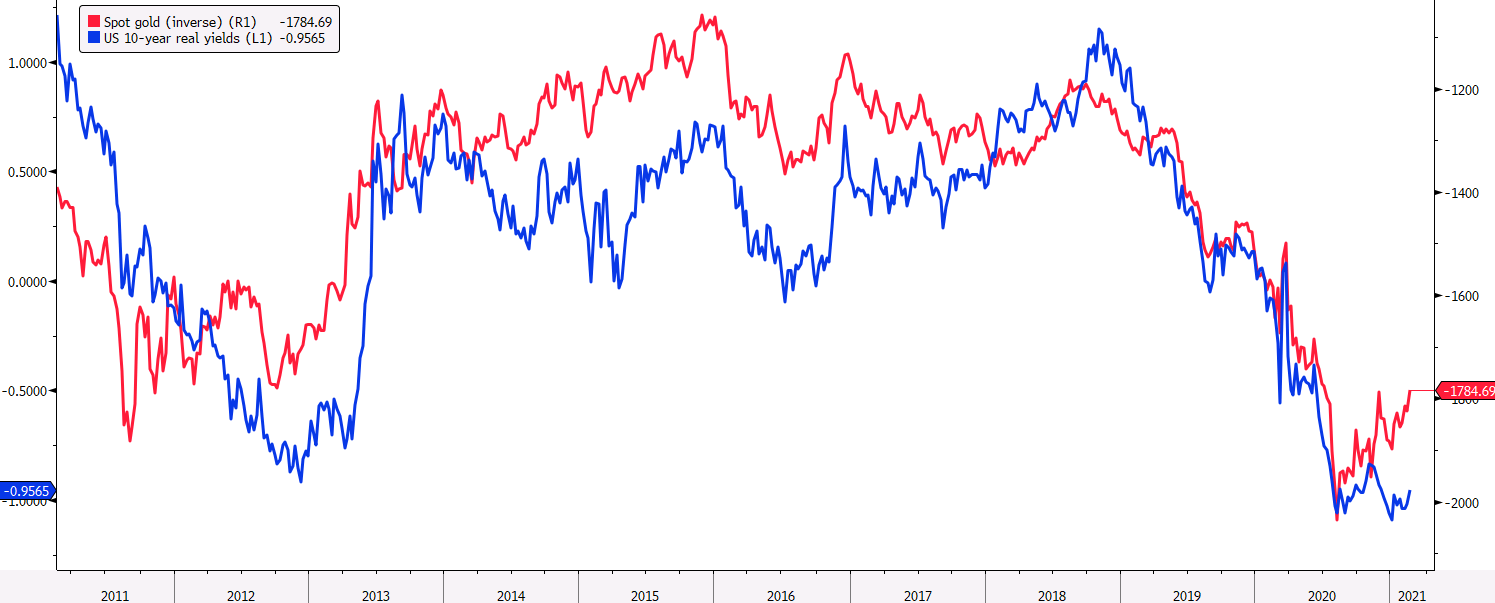
The good news for gold is that while breakevens and yields push higher, real yields are still more or less keeping rather depressed for the most part.

That might see this divergence eventually work its way back in favour of gold but again, there needs to be more things to corroborate with the story and for now, the technicals certainly aren’t shaping up all too well.
As mentioned above, the make-or-break level @ $1,764.80 remains the key line in the sand for gold as we look at how price action unfolds in the coming days/weeks.

