Products You May Like
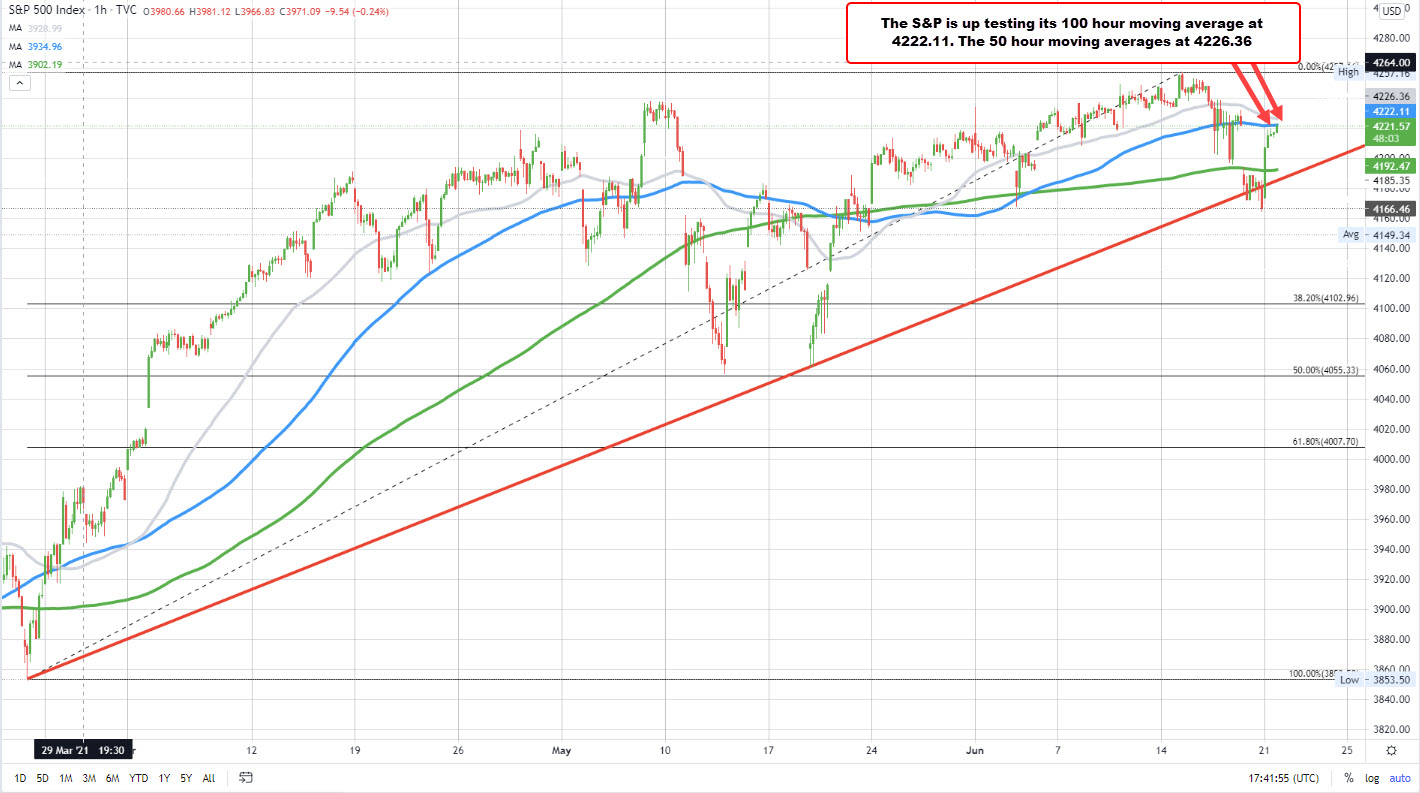
100 hour MA at 4222.08
The S&P index is trading to a new session high at 4222 and in the process is getting closer to its 100 hour moving average at 4222.08. A move back above that 100 hour moving average and 50 hour MA at 4226.30 would be a more bullish tilt technically for the broad index
The NASDAQ index has also made a new high of 14150.42. The currently trades at 141410.62, up 110 points.
The Dow industrial average is up 600 points or 1.8% at 33890. The new high just reached 33894.53.
WTI crude oil futures are being supported by the increased hopes for a Goldilocks Fed scenario. The price is currently up to dollars and $0.10 or 2.93% at $73.74. The high price reached $73.96. The low was down at $71.15.
This interest rates continue to take higher with the 10 year yield up 4.2 basis point at 1.480%. The 30 year yield is up 8.1 basis point at 2.094%. Last week the 30 year yield went down -12.19 basis points. The 10 year was down -0.87 basis points.
This article was originally published by Forexlive.com. Read the original article here.

