Products You May Like
- DXY consolidates the previous week’s losses, picks up bids to intraday high of late.
- Bullish candlestick formation above the key SMA support favors buyers.
- Late-April, early May top add to the downside filters.
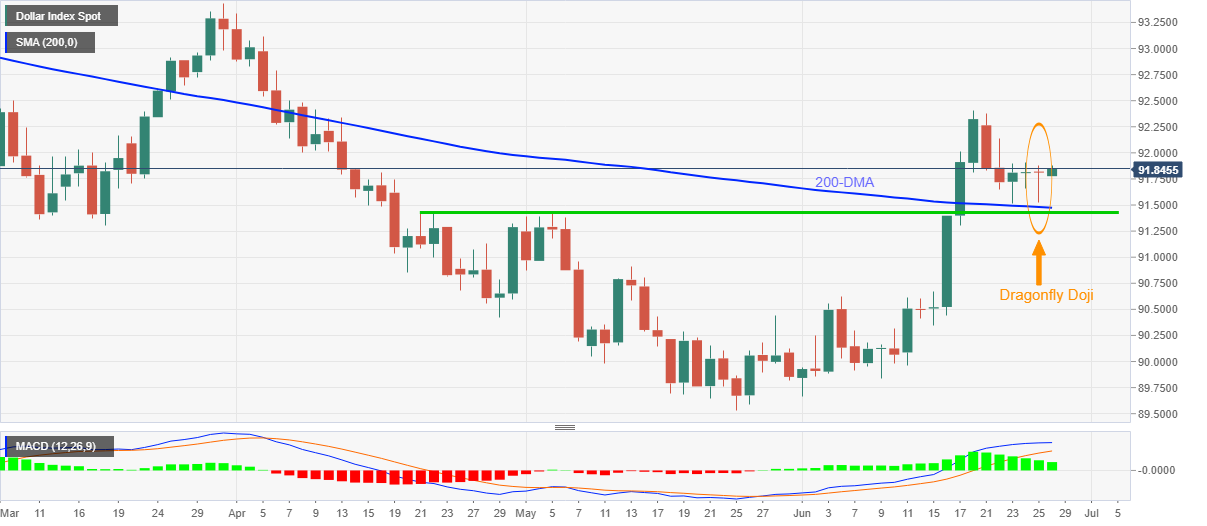
US dollar index (DXY) reverses the early Asian losses, attacks intraday top near 91.85, ahead of Monday’s European session. In doing so, the greenback gauge justifies Friday’s dragonfly Doji bullish candlestick above 200-day SMA, (DMA). Also favoring the USD optimists could be the bullish MACD.
Hence, DXY buyers are well-directed towards the 92.00 threshold before challenging the monthly top near 92.40.
However, the late March tops near 92.80 may probe the US dollar index bulls before directing them to the yearly peak of 93.43.
Alternatively, a downside break of 200-DMA, around 91.45 is a green pass to the DXY sellers are a two-month-old horizontal area around 91.40, which will validate the quote’s further downside.
On a clear break of 91.40, the mid-May top near 90.90 should return to the charts.
DXY daily chart
Trend: Recovery expected


