Products You May Like
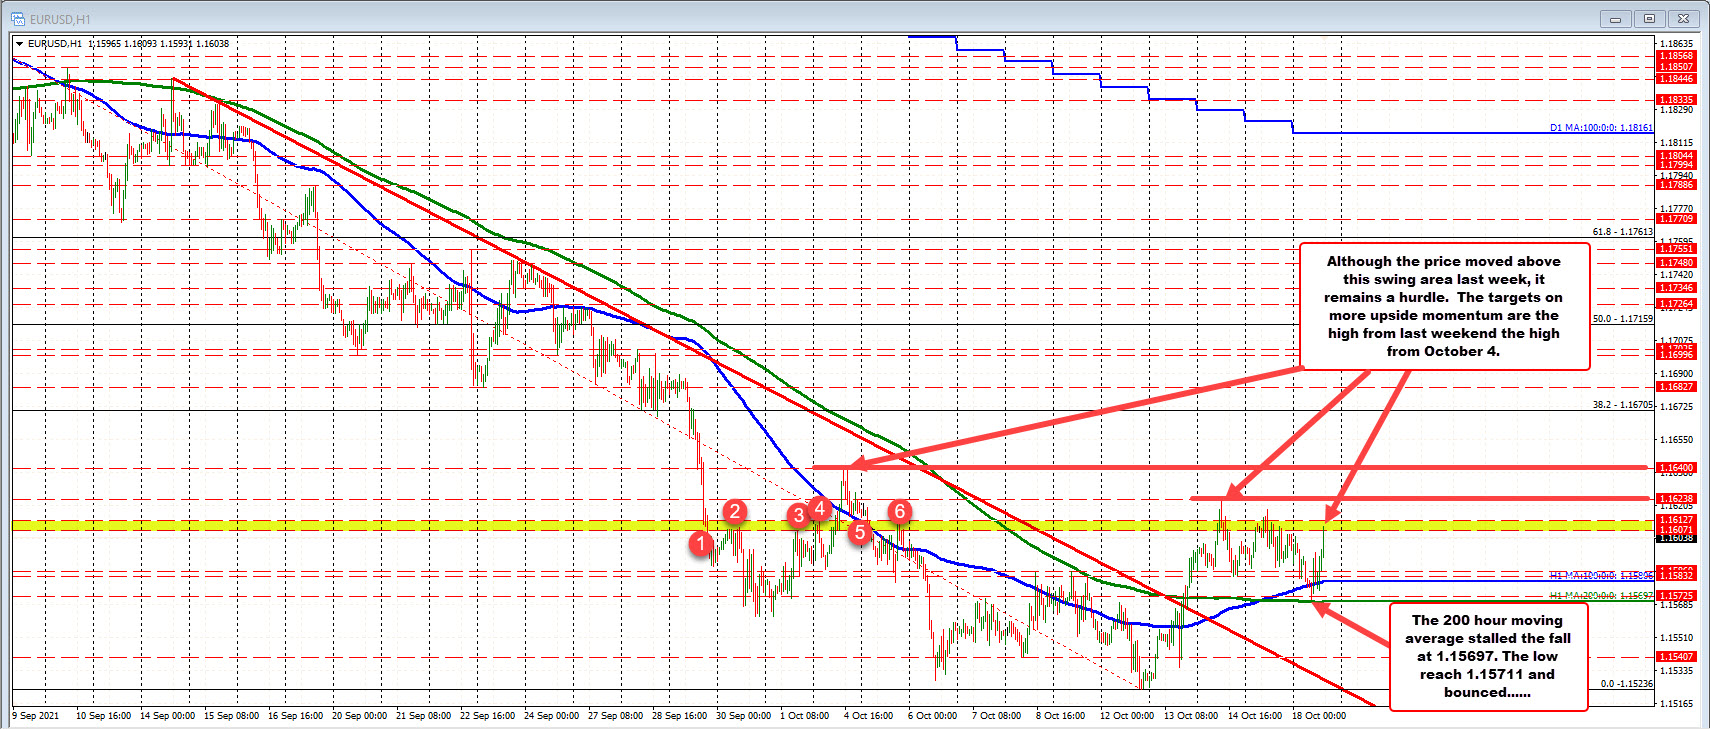
200 hour MA stalls the fall today
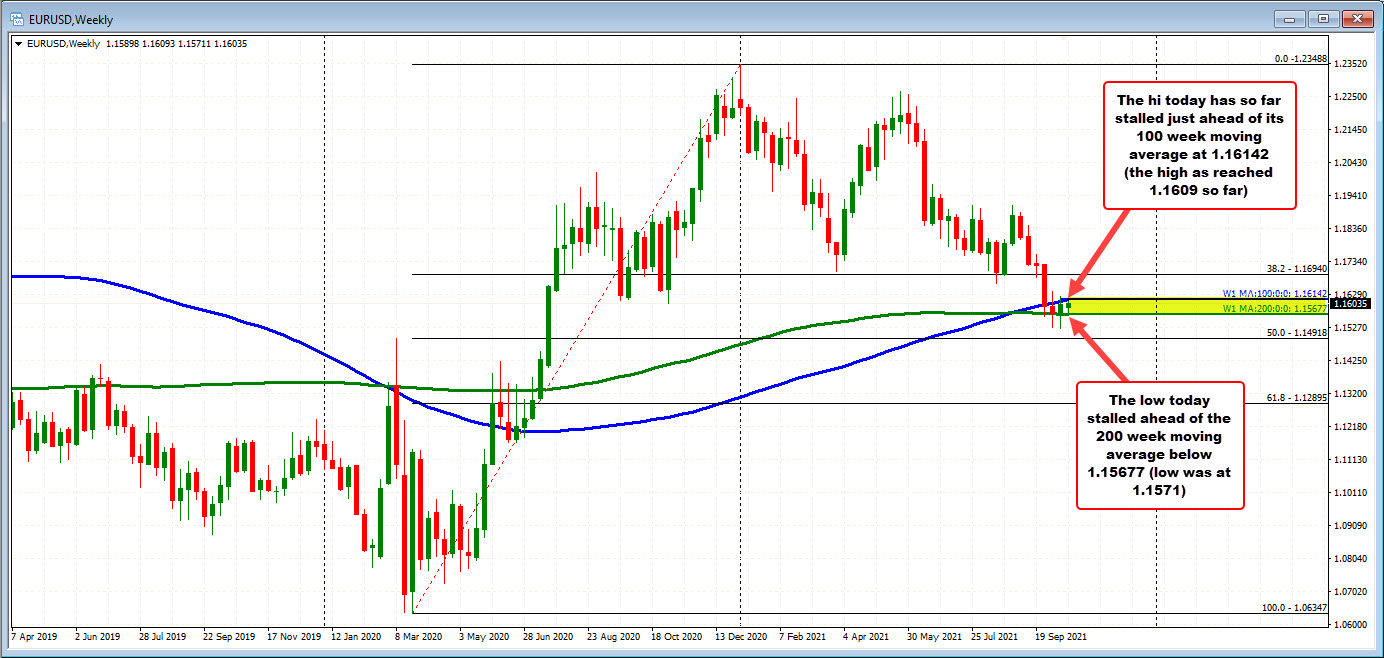
The run to the upside has seen the price move to a high of 1.1609 so far. The 100 week moving average currently comes in at 1.16142 (see weekly chart below). The price currently trading at 1.1602.

Going back to September and November 2019 (not shown), the low prices came in at 1.1601 and 1.1611. Finally on the hourly chart there is also a swing area between 1.1607 and 1.16127.
The current high just moved into that cluster of resistance between 1.1601 and 1.1614. It will take a move above all those levels and stay above to give the buyers more confidence. The high from last week at 1.16238 and the high from October 4 at 1.1640 are the next upside target followed by the 38.2% retracement of the move down from the September 3 high comes in at 1.16705.
If resistance holds, moving back below the swing area on the hourly chart between 1.1583 and 1.1586, the 100 hour moving average at 1.15806 (a moving higher) and the 200 hour moving average at 1.1569 (along with the 200 week moving average at 1.15677) are the downside targets.
So far for Monday, the technical levels are doing their job both on the downside in the upside in holding support and holding resistance. Traders are waiting for the next major shove outside of those technical levels

