Products You May Like
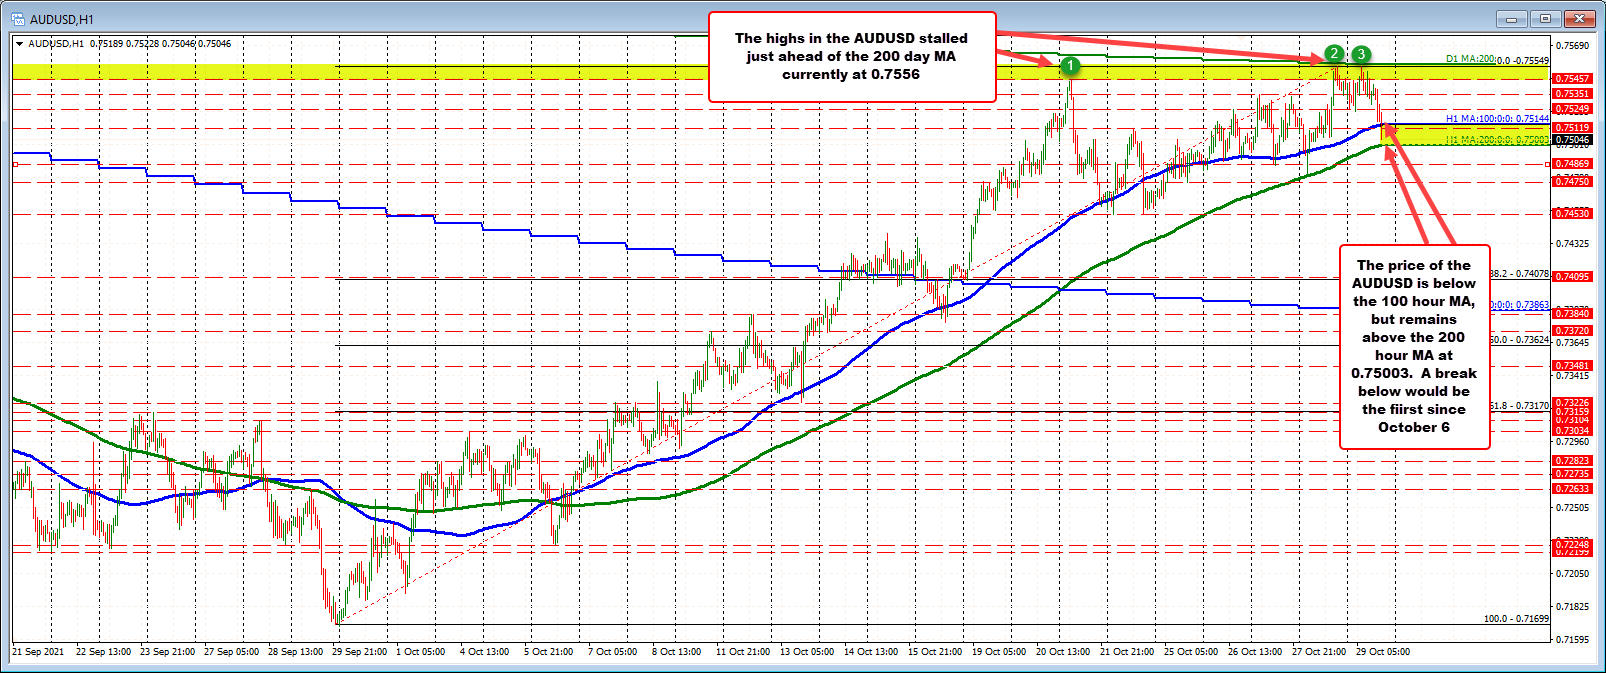
200 hour moving average at 0.7500 (nice round number)
The AUDUSD as work to a new session low of 0.75046. The move has now taken the price below its 100 hour moving average at 0.75144. Traders will line that level for bias clues. Stay below keeps the intraday sellers in control. Move above and the buyers hold the better hand.
On the downside, the pair is approaching its 0.7500 natural support level, along with the 200 hour moving average at the same level. The last time the price traded below its 200 hour moving average was all the way back on October 6. The price has been trending higher since bottoming on September 28.
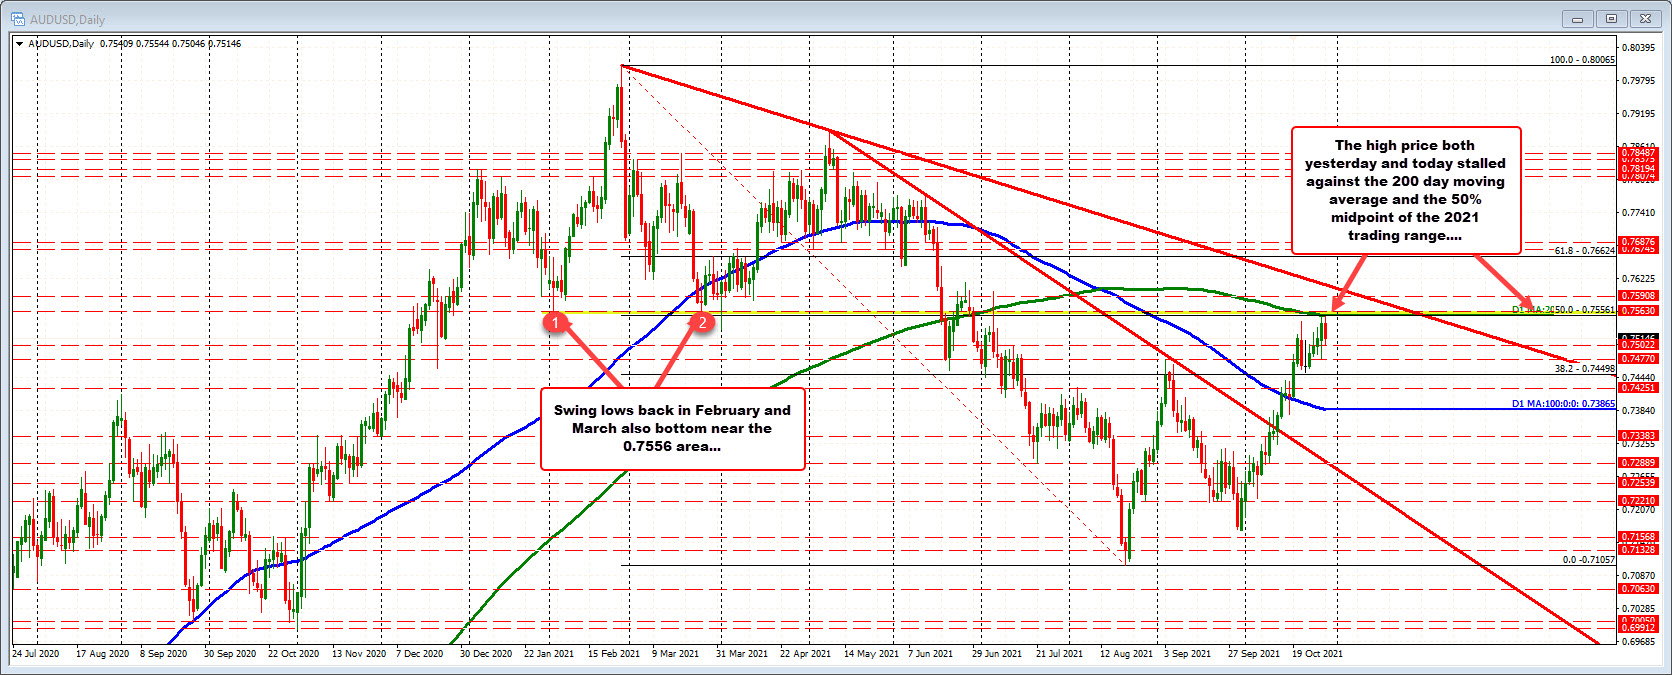
The trend move to the upside over the last month did find sellers against a key resistance level yesterday and again today. That resistance came against its 200 day moving average (green line in the chart below).
Looking at the daily chart below, the 200 day moving average was also joined by the 50% midpoint of the 2021 trading range (the high for the year was reached at the end of February with the low reached in August).
Needless to say, with both the 200 day moving average and 50% retracement at the same exact level of 0.7556, sellers felt confident to lean against the level (with stops likely on a break above). In addition to those technical levels, swing lows from February and March 2021 also were near that level increasing the levels of importance even more.

As a result, sellers do have some control from both the daily chart perspective (against 200 day moving average of 50%) and on the hourly chart (against its broken 100 hour moving average). However, a move below the 200 hour moving average is still needed to give those sellers some added confidence seen that that moving average has not been broken since October 6.

