Products You May Like
- GBP/USD keeps bounce off three-week-old support despite posting bearish candlestick the previous day.
- Multiple failures to cross 100-DMA, nearly overbought RSI challenges upside momentum.
- 61.8% Fibonacci Retracement adds to the upside filters, 50-DMA to lure bears after immediate trend line support.
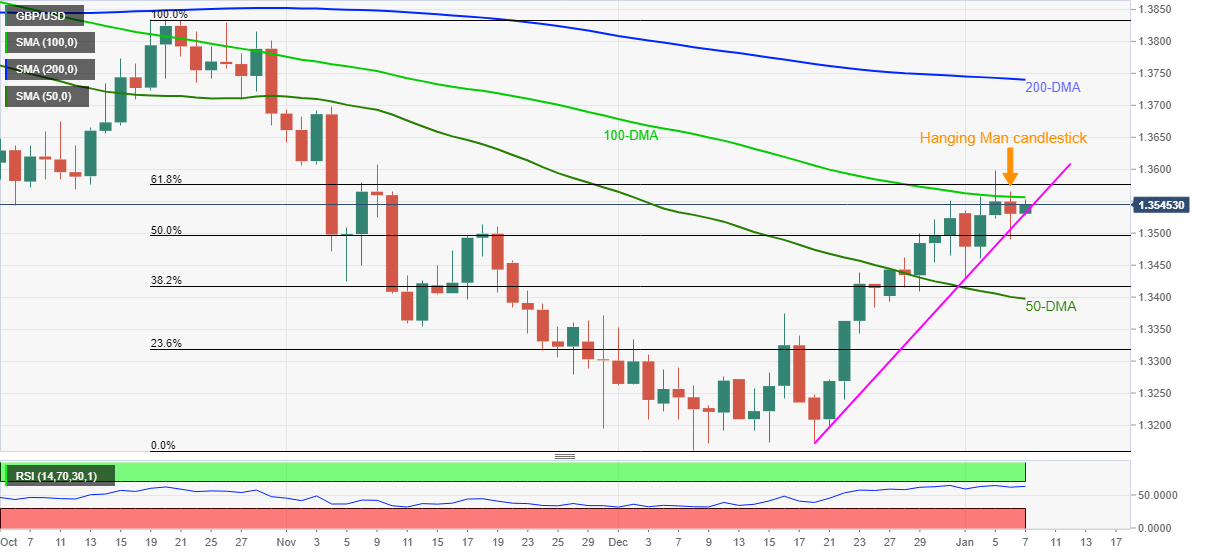
GBP/USD seesaws around 1.3550, up 0.12% intraday heading into Friday’s London open. In doing so, the cable pair stays firmer around a two-month top despite the previous day’s bearish candlestick formation, namely “Hanging Man”.
While an ascending support line from December 20 favors the corrective pullback, the 100-DMA challenges immediate upside around 1.3560 amid nearly overbought RSI conditions suggesting consolidation of recent gains.
Even if the quote manages to cross the 1.3560 immediate hurdle, 61.8% Fibonacci retracement (Fibo.) of October-December declines, around 1.3575, challenges the GBP/USD buyers before directing them to November 09 swing high close to 1.3610.
Alternatively, a downside break of the stated support line, near 1.3530 by the press time, will drag the quote towards the 50-DMA level of 1.3400, wherein the 50% Fibo. level surrounding 1.3500 may offer an intermediate halt.
During the GBP/USD weakness past 50-DMA, tops marked during late November and mid-December, around 1.3370-75, will be important to watch.
Overall, GBP/USD bulls have multiple hurdles to keep the reins while sellers have brighter scope for entries.
GBP/USD: Daily chart
Trend: Pullback expected


