Products You May Like

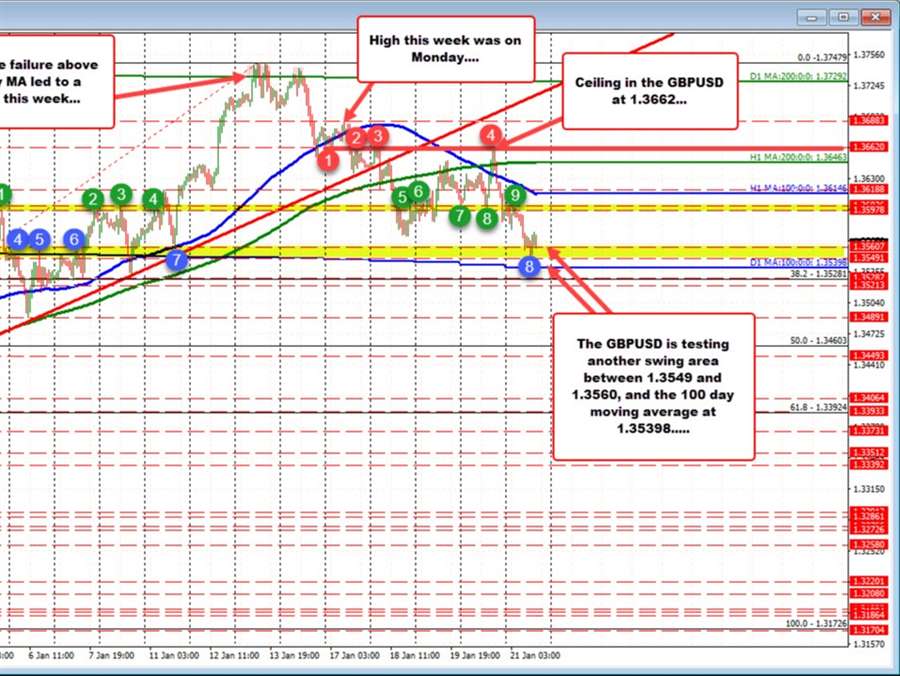
Recall from last week in the GBPUSD, pair moved above its 200 day moving average for the first time since September 2021, but the tries above that moving average failed. That led to selling on Friday last week and set up this week as a potentially more bearish bias. The high for the week was indeed on Monday just above its 100 hour moving average.
The price move below that moving average on Monday and remained below until yesterday when a spike higher took the price back up to retest a swing level at 1.3662. Sellers leaned and pushed back below the moving averages.
Today there is more momentum to the downside with new lows being made for the week. The pair has reached 1.3552. That low is in a swing area between 1.3549 and 1.35607. Just below that level sits the 100 day moving average at 1.35398. So far buyers are stalling the fall against the area. However a break below the 100 day moving average should see the buyers turned to sellers.
Taking a broader look at the daily chart, the pair has moved back below a broken trendline earlier this week, the price did fall below that line but quickly rebounded. It is also below the broken 38.2% retracement near the same level at 1.3575. Watch that level as resistance intraday.


