Products You May Like

The Nasdaq is down 3.5% from the close on Wednesday. The S&P is down about -2.35% (they are bouncing from lows too).
Those types of declines would typically lead to “risk off” flows out of pairs like AUDUSD. However, over that time period the price close on Wednesday was at 0.7194, while the current price is at 0.7186, down about 8 pips
So there has not been a lot of selling/risk off in the AUDUSD currency pair.
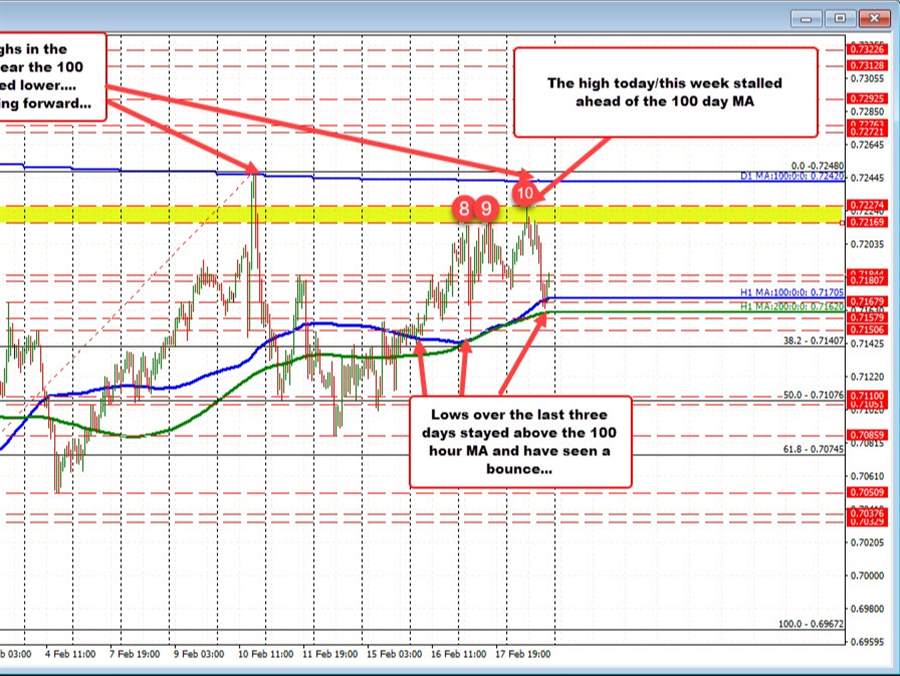
Helping has been the inability to extend back below the 100/200 hour MAs since breaking back higher on the end of day on Tuesday.
Looking at the hourly chart, the price low on Wednesday stalled below the 100 hour MA by a few pips, but remained above the 200 hour MA (green line).
On Thursday, the price fell in the Asian session but stalled once again ahead of the near converged 100/200 hour MAs at the low. Today, the lows on the day moved below the 100 hour MA but once again stalled ahead of the 200 hour MA (green line).
Stay above those MAs keeps the buyers in control. That is definitely a help and has helped to limit the downside over the recent stock declines over the last few days..
On the topside, it’s not all run to the upside.
The high price from last week stalled right near the 100 day MA. Going back to January 20, the 100 day MA also stalled the rally. This week (today), the high reached to 0.72274. That high sniffed, but did not exactly pressure the 100 day MA at 0.7242 (within 15 pips).
So, there is an upside tilt, but the move higher is also limited.
Going into next week, the levels will remain the same. Stay above the 100/200 hour MA is bullish/move below would be bearish. However, getting above the swing area up to 0.7227 and the 100 day MA at 0.7242 would still be needed to increase the bullish bias going foward. .

