Products You May Like
- USD/CAD fades the previous day’s rebound from three-week low.
- 50-SMA, one-week-old resistance line guards immediate upside.
- 200-SMA, 50% Fibonacci retracement limit short-term declines ahead of 1.2560-55 area.
- Firmer RSI, likely priced-in BOC rate-hike keep buyers hopeful to visit 1.2800 resistance.
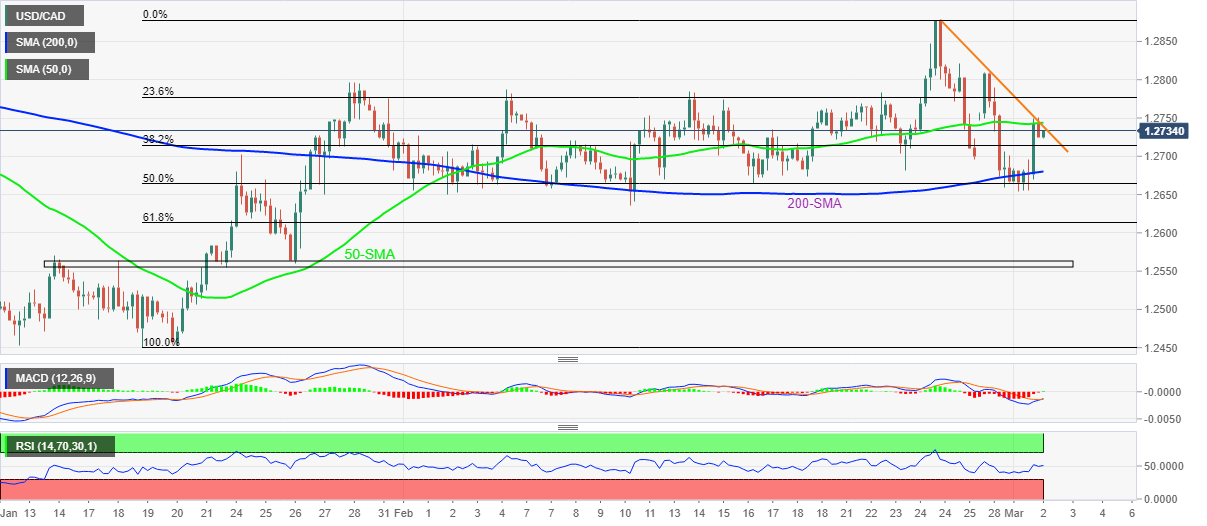
USD/CAD eases from the weekly top to 1.2730 during the initial Asian session on Wednesday. In doing so, the Loonie pair steps back from the convergence of the 50-SMA and one-week-long descending trend line ahead of the key Bank of Canada (BOC) monetary policy meeting.
Although the BOC is up for the first rate-hike since 2017, the action has mostly been priced-in, which in turn favors the odds of the pair’s run-up should the forward guidance disappoint traders.
Read: Bank of Canada Rate Decision Preview: Hawkish hike to exacerbate the pain in USD/CAD
Technically, sustained trading beyond the key SMAs join firmer RSI and receding the bearish bias of MACD to hint at the pair’s further upside.
However, a clear break above the 1.2745 immediate hurdle becomes necessary for the USD/CAD bulls to aim for January’s high near 1.2800.
Should the quote rises past 1.2800, the latest swing top surrounding 1.2880 will be in focus.
On the contrary, pullback moves may initially aim for the 200-SMA level surrounding 1.2680 ahead of the 50% Fibonacci retracement (Fibo.) of January-February upside, near 1.2660.
Following that, a six-week-old horizontal area near 1.2560-55 will lure the USD/CAD bears.
USD/CAD: Four-hour chart
Trend: Further upside expected


