Products You May Like

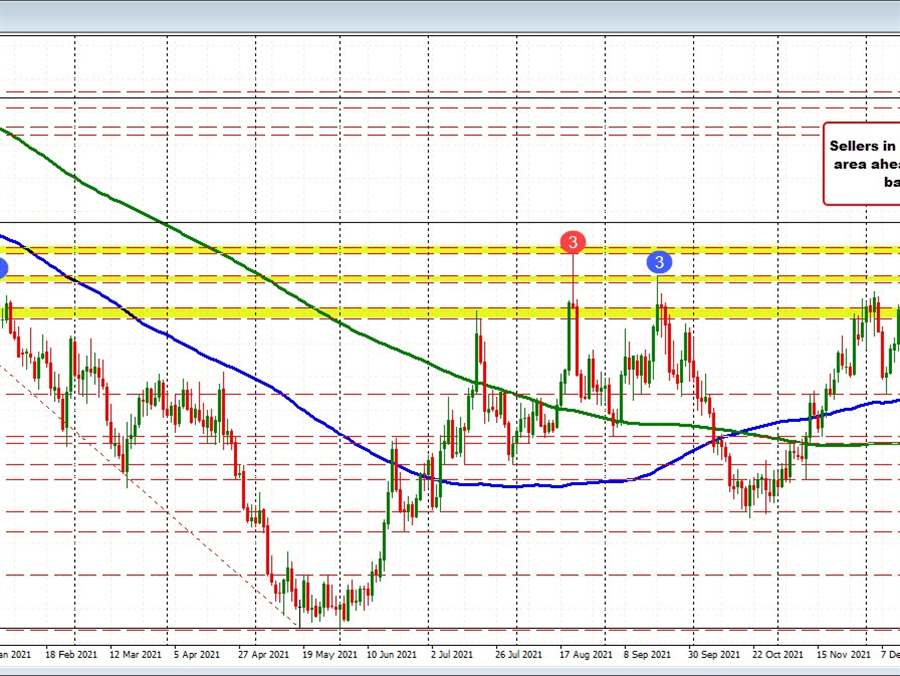
The USDCAD raced up over the previous 4 trading days moving from a low on the daily chart between the 200 and 100 day MAs at 1.2586 and moving up a high of 1.2900 yesterday. The high price yesterday tested a swing area between 1.2877 and 1.2996. The price extended above that area but only by a few pips.
Today, the high stalled within that area at 1.28932 and rotated back to the downside with the overall dollar selling on the flight out of the safety of the USD.
The fall has retraced most of the gains seen yesterday, and took the pair back between another swing area between 1.27857 and 1.28132. The low price reached 1.2802 so far. Move below that area would be more bearish.
Drilling to the 5 minute chart below, the run higher from the Monday low has now seen a retracement between the 38.2% to the 50% midpoint between 1.28178 and 1.27923 (the 50% is near the 1.27857 level on the daily chart). There are a number of swing highs and lows between 1.27913 and 1.2806 as well.
In the short term, moving below that area would give sellers more reasons to sell. Another target would be the rising 100 hour MA at 1.27778. The low on Monday, found support buyers near the 100 hour MA at the time.
With the 100 hour MA at 1.27778 (and moving higher), the swing level on the daily chart at 1.27857 and the 50% midpoint of the week’s trading range at 1.27923, the area between 1.2778 and 1.27923 is shaping up as a key downside support area.
Be aware.


