Products You May Like

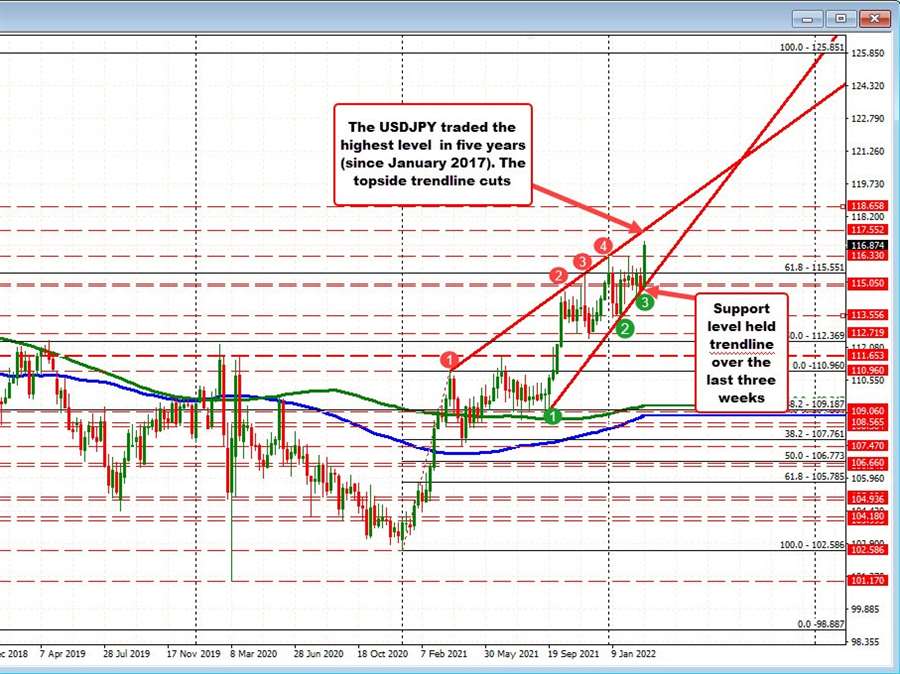
The price of the USDJPY as traded to the highest level in five years on a surge higher today (highest level since the week of January 8, 2017).
Looking at the weekly chart, the move higher today surpassed the February 6, 2022 high at 116.33.
Looking at the weekly chart, the fall off the February 6 high came down to test the lower trendline connecting recent lows going back to September 2021. Holding that level over the last three weeks Gay buyers something to lean against. Staying on that chart, the topside trendline connecting highs from April 2021, November 2021, and more recently January 2021, cuts across at 117.55 (and moving higher.
Drilling to the hourly chart below, yesterday the price highs stalled near the same level at 116.18. In the early Asian session, the price started to move above that double top level, and then after a brief failure above the swing high from February at 116.33, the pair regrouped, pushed above the 116.33 level with more momentum, and the race to the high was on.
The high price for the day has reached 117.055. The price has been consolidating between 116.78 and 117.05 over the last seven or so trading hours (bull pennant?).

Drilling even further to the five minute chart below, the consolidation near the high has now seen the 100 bar moving average (blue line) catch up to the price. That moving average can be a bias/risk defining level in the short term.
The intraday buyers are so far leaning against that level.
However, if sellers can push below, the next short-term target would be at 116.788 (swing highs and lows today) below that the 38.2% retracement of the last trend leg to the upside at 116.735 followed by the rising 200 hour moving average and 50% midpoint at 116.637 would be targets. Move below the 200 bar moving average of 50% would spoil the mood for the buyers today.


