Products You May Like
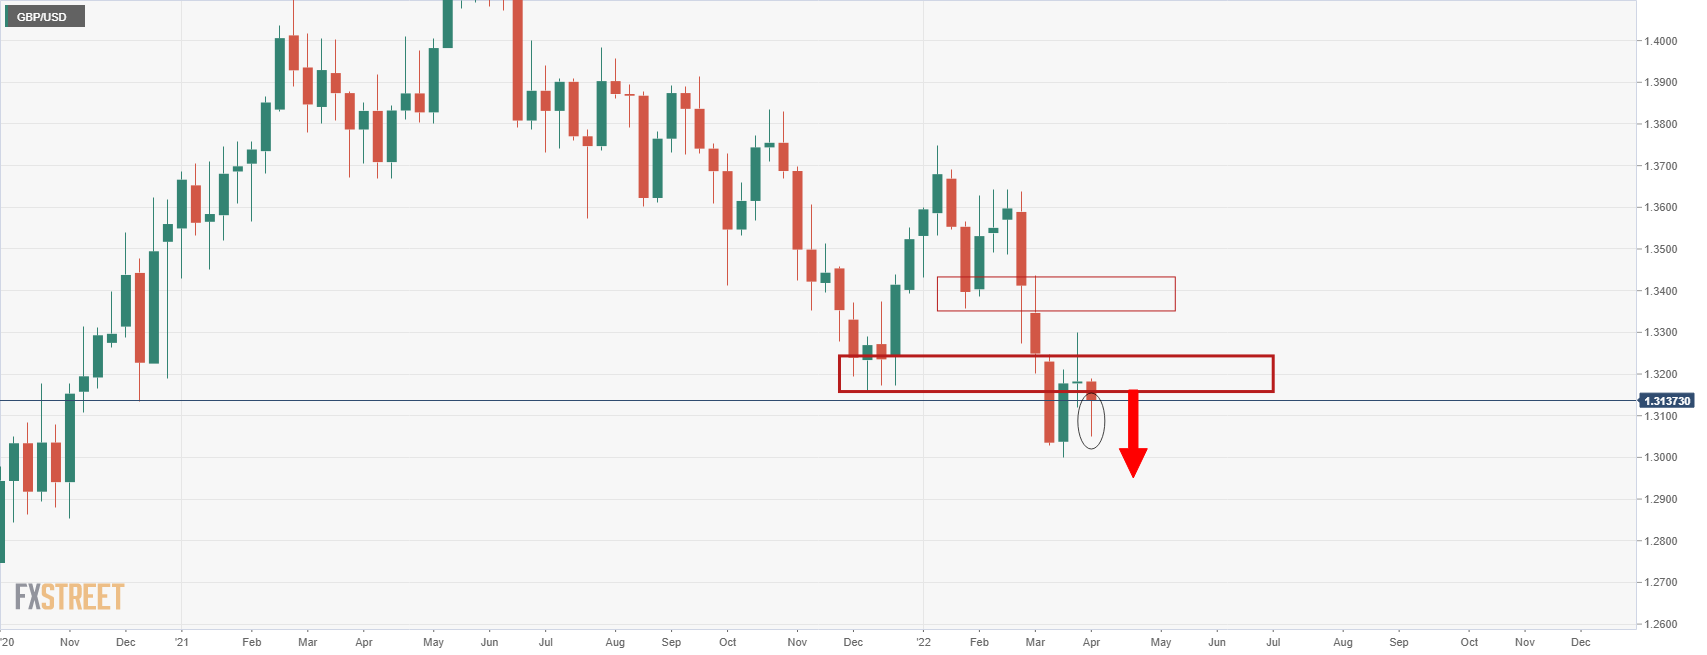
- GBP/USD on the verge of a bearish weekly close.
- Bears are seeking a fill of the weekly wick and a downside extension.
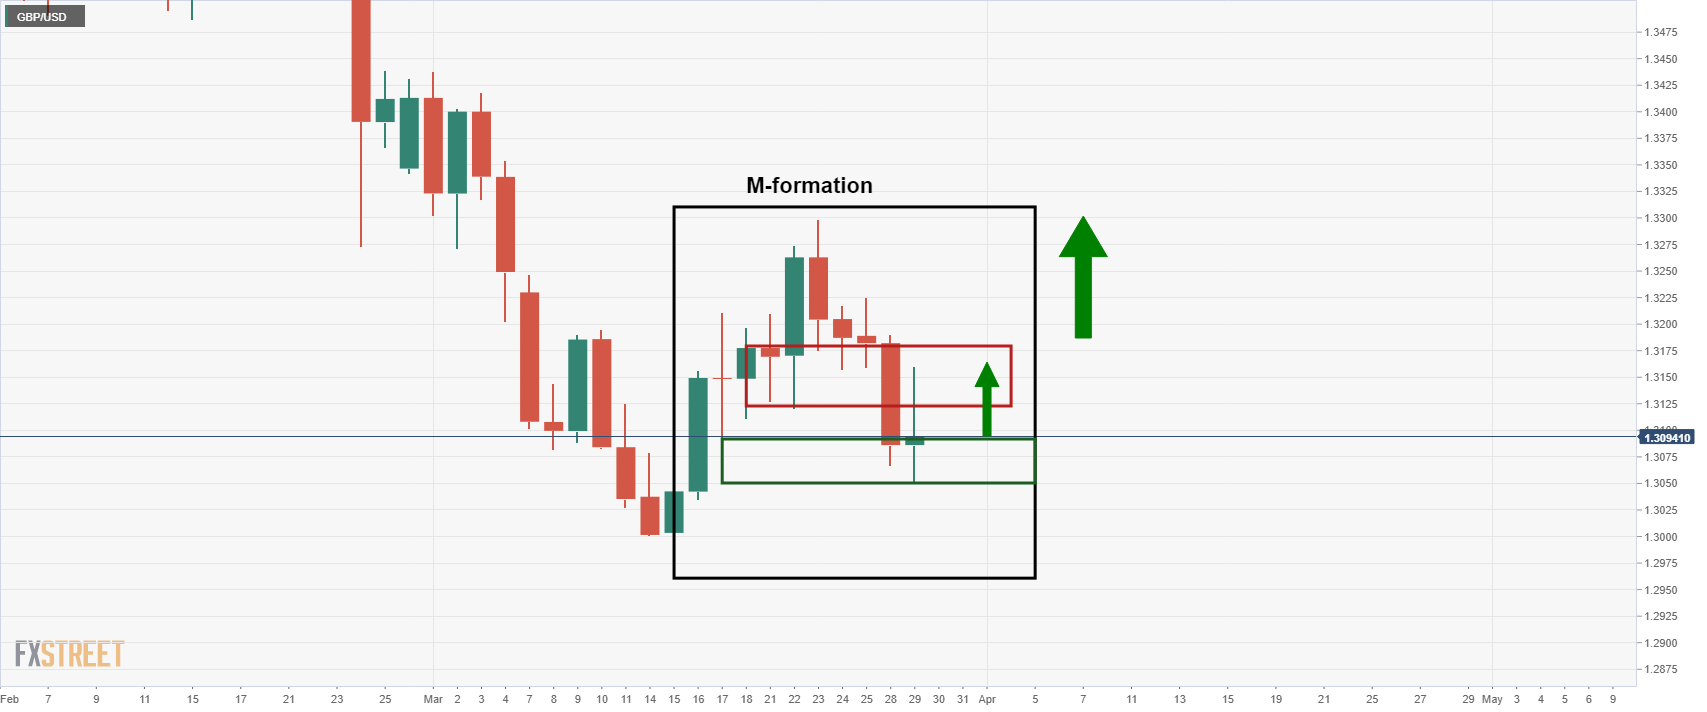
The following illustrates the pound’s bullish trajectory on the daily chart in an M-formation as per prior analysis and live updates:
GBP/USD daily chart
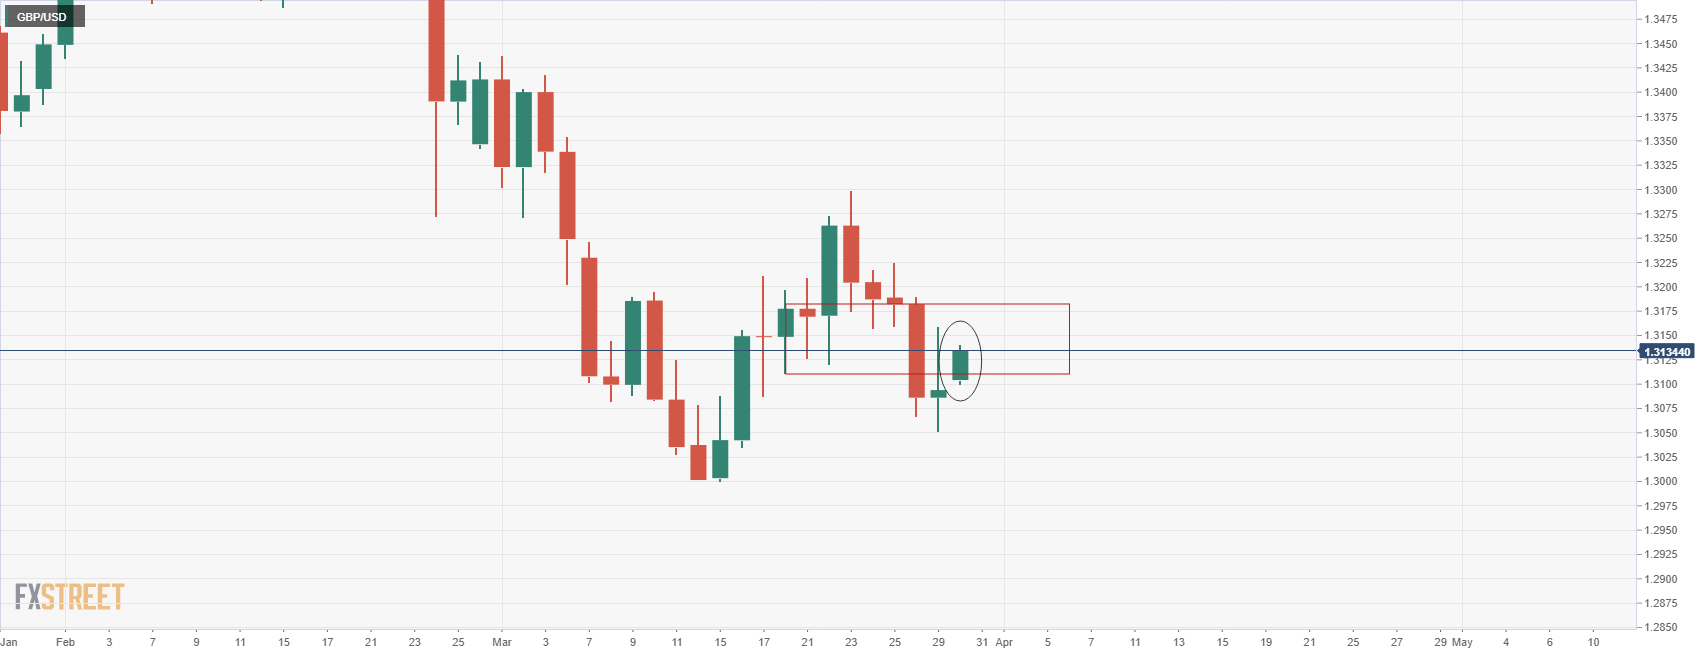
The chart above was from the prior day’s close. The price attempts to recover towards the neckline of the formation:
GBP/USD live market
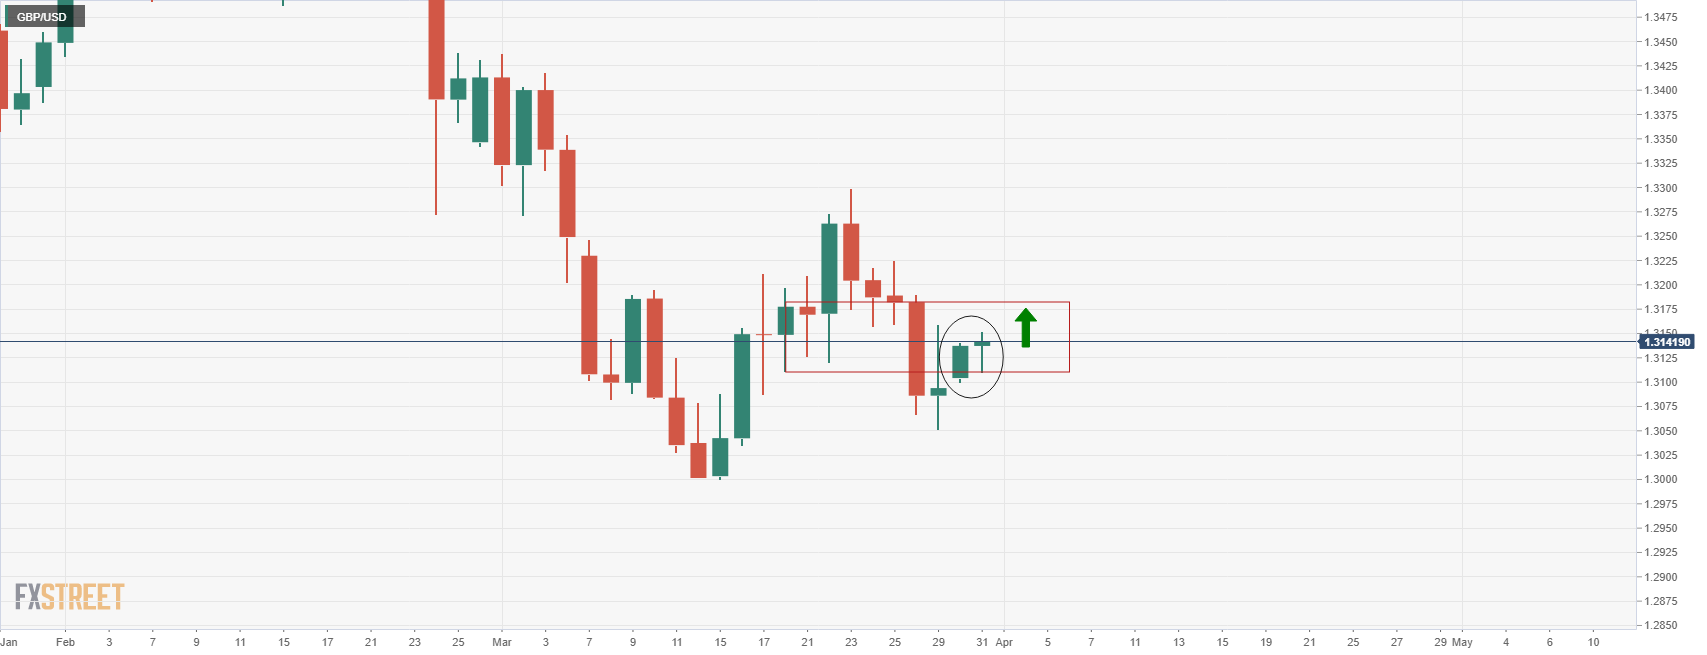
The price is making slower progress on Thursday and given that it has now made a significant correction, the weekly chart’s doji candle should be considered as bears seek a weekly bearish close:
GBP/USD weekly chart
The pair has formed a weekly doji and bears will now be on the lookout for this week’s close to print bearish. So far so good in this respect and the wick would be expected to be filled in next week with a move that could result in a downside continuation.
This article was originally published by Fxstreet.com. Read the original article here.

