Products You May Like

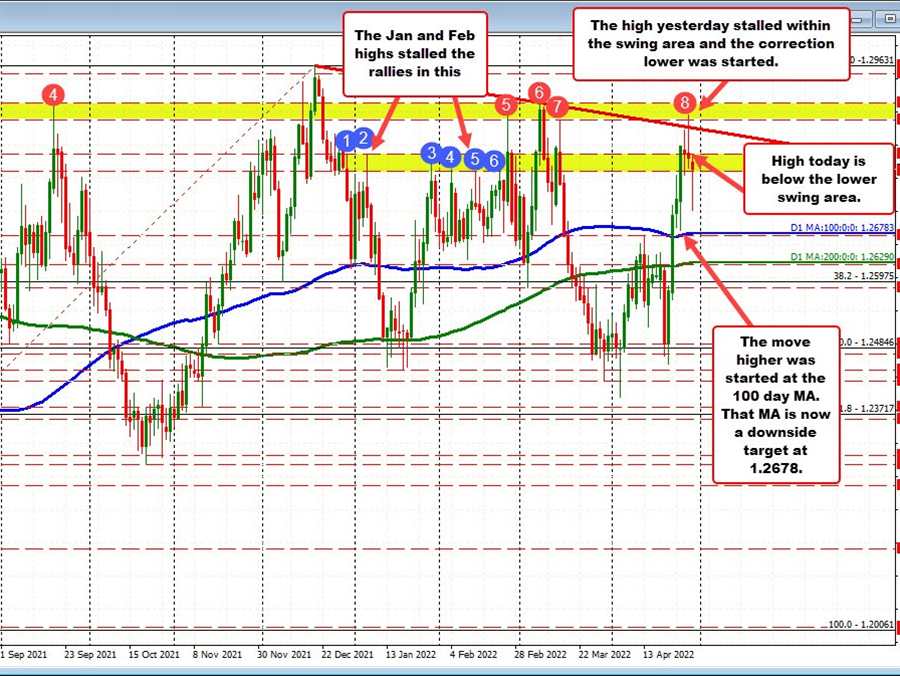
The USDCAD ran to the highest level since March 9 yesterday/this week, and in the process entered into a swing area on the daily chart between 1.28709 and 1.29001.
However, sellers entered within that swing area (the high price reached 1.2879) and pushed the price down away from that resistance swing area (see red numbered circles in the chart above).
The USDCAD closed lower for the second consecutive day yesterday but stalled the fall between a lower swing area between 1.27832 and 1.28132 (see post yesterday outlining the levels).
In trading today, the high price reached 1.2811 (just below the high of the lower swing area) and a further run to the downside was started after breaking 1.27832.
Looking at the hourly chart below, the low price today reached 1.2718 (65 pips from the 1.2783 break point). That level was right at the 38.2% retracement of the move up from last Friday’s low at 1.2718.
Buyers leaned against that retracement level and have since pushed the price back up toward it’s 100 hour moving average currently at 1.27876. That level also happened to be the low price from yesterday and within a swing area between 1.2776 and 1.2797 (see red numbered circles in the chart below).
What now?
If the 100 hour MA (and swing area) can hold resistance, the buyers and sellers will continue their battle between the 38.2% below and the aforementioned resistance near the 100 hour MA area.
Conversely, a move above 1.2797 and sellers are losing again.
Key resistance area being tested. Time will tell if it can hold and keep corrective probing in play going forward.


