Products You May Like

The GBPUSD has seen down, up and now back down price action since the US jobs report.
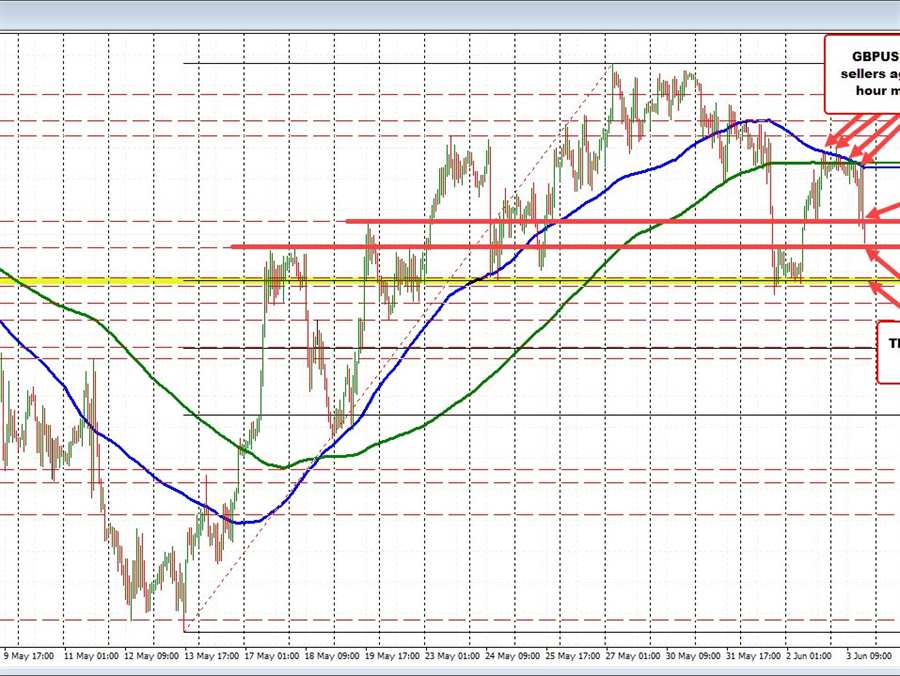
The price initially moved to the downside falling to a low of 1.25197 shortly after release of the jobs report. That took the price below a swing level at 1.2524, but only briefly before bouncing back to the upside.
That squeeze higher took the price back up to retest its 100 and 200 hour moving averages near 1.2575. Earlier today and yesterday, traders leaned against those moving averages and did a pretty good job of stalling the rallies. This rally was no exception. Buyers turned to sellers and the price has moved lower.
The 1.2524 level has now been broken and is now close resistance/risk. The 1.2500 is the next downside target followed by the 38.2% retracement of the move up from the May 13 low. That level comes in at 1.24705.
Yesterday, the price low was near that 38.2% retracement level before racing to the upside. On Wednesday, the price moved below that level but could not sustain momentum, quickly rebounded. Not being able to stay below the 38.2% retracement was a red flag for traders, and help to contribute to the upside momentum during yesterday’s trade.
Having said that, the 100/200 hour moving average hold on the rally is also a red flag for traders and has contributed to the downside momentum.
What next?
With the 1.2524 level now broken, can the momentum take the price back down toward a retest of the 38.2% retracement area and give the sellers another opportunity to break the GBPUSD pair lower?
Stay below 1.2524 and that will be the path of least resistance.
PS The formation on the hourly chart looks head and shoulder-ish

