Products You May Like
- Gold Price is extending a two-day bearish momentum on Friday.
- The US dollar reigns supreme as risk-aversion remains at full steam.
- XAUUSD appears vulnerable, with all eyes on next week’s Fed decision.
Gold Price is trading with size-able losses on the final trading day of the week, as investors continue to seek refuge in the safe-haven US dollar amid persistent fears over rising inflation and a potential recession. Central banks tightening worldwide to quell inflation have re-ignited growth fears. The yellow metal is leaning bearish, despite a minor pullback in the US Treasury yields, as hot inflation and pre-Fed meeting anxiety keep the sentiment around the dollar underpinned.
Also read: Gold Price Forecast: XAUUSD at a critical juncture, US inflation holds the key
Gold Price: Key levels to watch
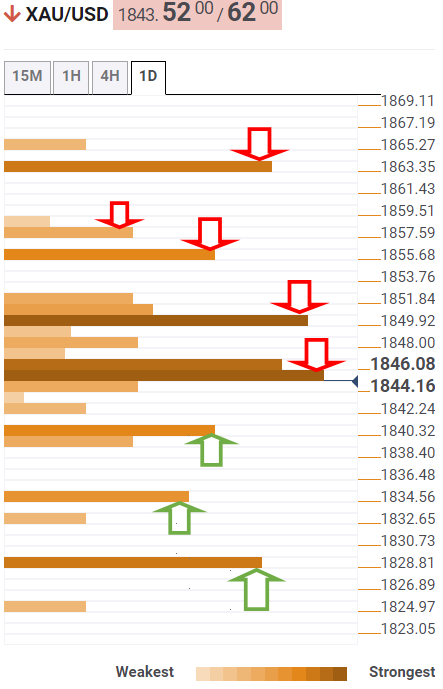
The Technical Confluence Detector shows that Gold Price is teasing the crucial SMA200 one-day support at $1,842.
A sustained move below the latter will put the previous day’s low of $1,840 at risk. At that level, the pivot point one-day S1 and Fibonacci 23.6% one-week merge.
The next relevant downside target is seen at $1,833; the confluence of the Fibonacci 38.2% one-month and the pivot point one-day S2.
The line in the sand for gold buyers is aligned at the intersection of the previous week’s low and the pivot point one-week S1 at $1,829.
On the upside, powerful resistance appears around the $1,845 region, where the SMA5 four-hour, Fibonacci 38.2% one-day and one-week coincide.
Further up, bulls will challenge the SMA5 one-day, Fibonacci 61.8% one-day and SMA10 one-day convergence at $1,850.
Acceptance above the latter will open doors for a fresh advance towards the previous day’s high of $1,855, above which the Fibonacci 61.8% one-week at $1,857 will be probed.
The meeting point of the Fibonacci 61.8% one-month and the pivot point one-day R2 at $1,863 will be a tough nut to crack for XAU bulls.
Here is how it looks on the tool
About Technical Confluences Detector
The TCD (Technical Confluences Detector) is a tool to locate and point out those price levels where there is a congestion of indicators, moving averages, Fibonacci levels, Pivot Points, etc. If you are a short-term trader, you will find entry points for counter-trend strategies and hunt a few points at a time. If you are a medium-to-long-term trader, this tool will allow you to know in advance the price levels where a medium-to-long-term trend may stop and rest, where to unwind positions, or where to increase your position size.


