Products You May Like
USDCHF races higher.
The USDCHF has moved up on each of the trading day’s this week. That move took the price from a London low at 0.9400 to the high today at 0.95968 for a low to high range of 197 pips or 2.08%.
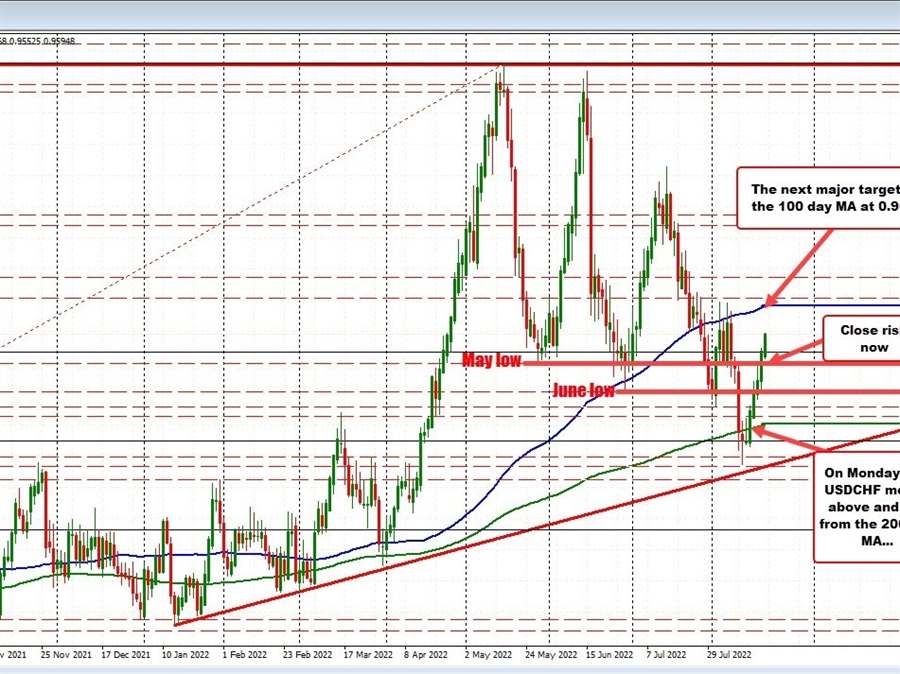
Looking at the daily chart, the USDCHF has seen a number of trending up and down moves since April. For August, the initial move was higher. The price moved above the 100 day MA (blue line) on 3 separate days during the first 6 days of the month, but could not close above that MA level.
That led to a move down which saw the 200 day MA (green line) broken during last weeks trading. The low reached last week, fell and closed below the 200 day MA, but stalled within a swing area between 0.93659 and 0.93822.
On Monday of this week, the price moved back above the 200 day MA and the move to the upside was started. Sellers turned to buyers.
Technically, the price move back above its early August swing low at 0.9469 on Tuesday, then above its June swing low at 0.9495 on Wednesday. The high on Wednesday stalled against the low from May at 0.95449. Yesterday, the price based against that June low and moved higher breaking through the May low in the process.
The next major target on the daily chart comes in against its 100 day moving average currently at 0.9643. The price is still some 47 pips away from that level, but given the trending nature of the pair of late, getting to that level is not a hard lift.
Close risk now would be the swing low from May at 0.95449. Stay above is more bullish

