Products You May Like
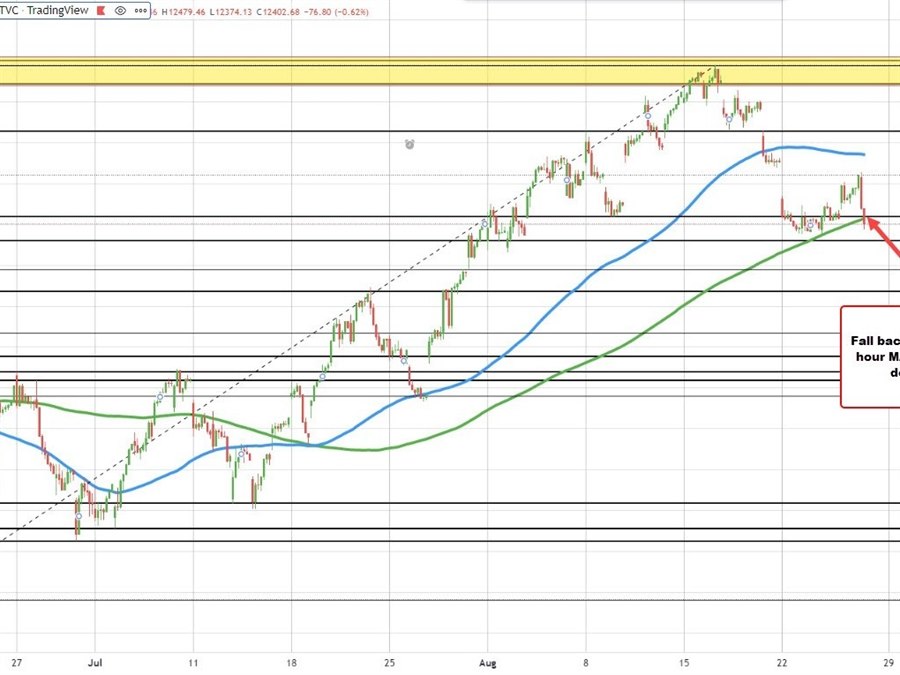
NASDAQ is back below its 200 hour moving average
The major US indices are lower and that move has now pushed the tech heavy NASDAQ index back below its 200 hour moving average of 12425.85. The low rached 12374.13. The current price is at 12399.22. Stay below would tilt the bias more to the downside. The low for the week reached 12350.16. The 38.2% target retracement of the short covering move higher comes in at 12176.36
Looking at the S&P index, it still remains above its rising 200 hour moving average of 4120.95. The low price reach 4126.00.
S&P index is still above its 200 hour moving average
The USD is continuing its move back to the upside.
- The GBPUSD is now below its 100 hour moving average 1.18047 (trades at 1.1793).
- The EURUSD is below its 200 hour MA at 1.0041 (trades at 1.0018)
- The USDJPY is running away from its 100 hour moving average of 136.189. It trades at 137.25
- The USDCAD is back above its 100 hour moving average at 1.29734. It currently trades at 1.2984
This article was originally published by Forexlive.com. Read the original article here.

