
Products You May Like
GBPUSD reaches its 1st upside target area
The stocks in the US have a erased their declines and are trading in positive territory. US yields remain higher especially in the shorter end but the 30 year bond is now at near unchanged on the day.
The higher stocks have led to a move lower in the dollar.
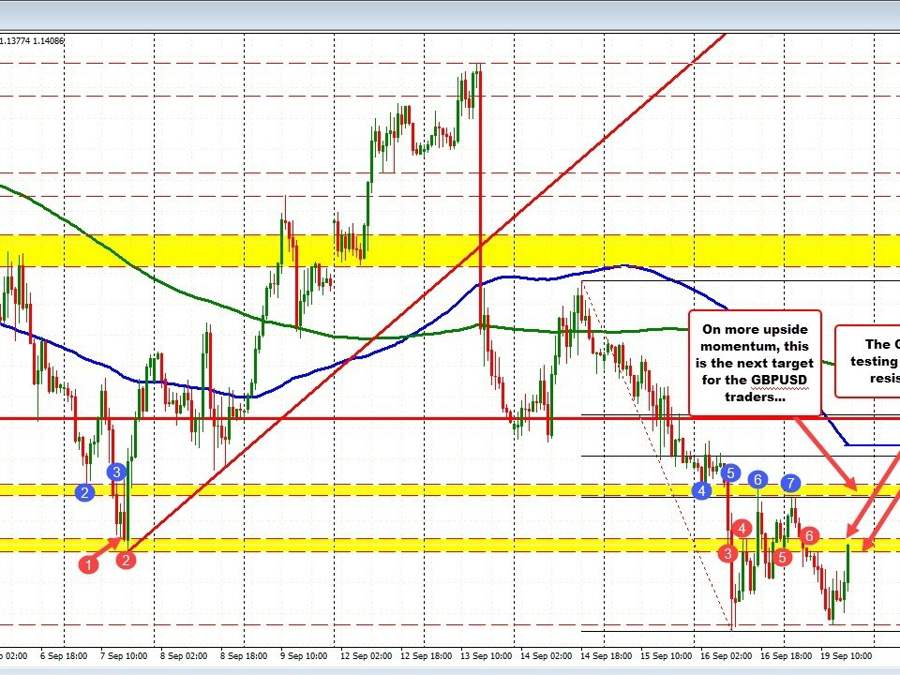
For the GBPUSD , technically, the low price today fell short of the low price on Friday. Recall from my early video (go to 4:12 on that video), and video over the weekend (go to 5:12 on that video to see the GBPUSD analysis), the GBPUSD move to the lowest level since 1985 on Friday to 1.13496. Today the low price could only reach 1.13543. Buyers against the low from Friday leaned on hopes of a rebound. That is happening.
The price in the last hour has seen advancement into the 1st target resistance area. That level comes between 1.1404 and 1.14131. Looking at the hourly chart above, the 1.14042 level was the swing low going back to September 7. Not shown is the 2020 low price which came in at 1.1408. The 1.1413 level represents some other swing levels going back to September 7.
Getting above that area (1.1404 to 1.1413) would have traders targeting the 38.2% retracement of the move down from last Wednesday’s high at 1.1441. That retracement level also corresponds with swing levels (see blue numbered circles) between 1.1442 and 1.14499. The 100 hour moving average at 1.14764 is another key upside target that would need to be broken if the buyers are to start to take more control away from the sellers.
Sellers had their shot to take out the low from Friday. Buyers leaned. The ball remains in the buyers court to get above the aforementioned resistance up to 1.1413 and stay above that level. That would be step 1. Getting above the other swing area up to 1.14499 would be step 2 followed by the 100 hour moving average (which is declining and currently at 1.14764).
Conversely not being able to get above those levels makes the bounce off the low just a modest dead cat bounce. That would keep the sellers still in firm control and the trend lower intact.
Looking at the weekly chart the price low last week tested the declining trend line and found buyers. That trend line represents a downside target to get to and through (it is lower this week at 1.1326 this week).
Going back to 2020, the low from the March 22 week reched 1.14454. That dovetails roughly with the 1.14499 level on the hourly chart increasing that areas importance on more upside momentum today/this week. Be aware.
GBPUSD on the weekly chart