Products You May Like
- Gold bulls in charge and eye mitigation towards $1,670 that guard $1,675 and $1,688.
- The US dollar continues to bleed out into month-end flows.
The gold price has started to find support in the correction of the recent bullish impulse but is back to trading near flat on the day at around $1,660 following a run from a low of $1,641.57 to the day’s high of $1,664.89. The US dollar continued to ease despite bond yields rising and concerns rising interest rates will lead to a global recession. Month-end flows could be the culprit that is moving out of a heavily committed play by long positioning of late.
What would usually be weighing on the price of gold, bond yields have been moving up amid rising interest rates. The US 10-year note’s yield was last seen higher by some 0.37% to 3.7510%. The high of the day, however, was at 3.868%. To date, rising yields have weighed on the unyielding precious metal. However, its safe-haven allure has kicked in as market turmoil has led to an unwind of the greenback late in the month, falling sharply from a 20-year high. The US DXY index, which measures the greenback vs. a basket of currencies dropped again on Thursday, making gold more affordable for international buyers. Trading at 112.20, the index is down 0.45% on the day, balancing above the lows of 112.104.
However, as soft as the US dollar is in comparison to the recent highs, analysts at TD Securities still argue that ”The risk of capitulation remains prevalent for the yellow metal moving into an October with key labor market and inflation data on tap before the next Fed meeting.”
”With prices trading below pandemic-era levels, a small number of family offices and proprietary trading shops are increasingly feeling the pressure to finally capitulate on their massively bloated and complacent length in gold. Rates markets are pricing the potential for higher interest rates to persist for some time, and a steady stream of Fedspeak is likely to hammer this point home,” the analysts explained.
”In this sense,” they said, ”our analysis suggests gold prices could still have further to fall in the next stage of the hiking cycle. Indeed, the increase in inflation’s persistence suggests that a restrictive regime may last longer than historical precedents, which argues for a more pronounced weakness. The combination of surging real rates and USD, continued outflows from money managers and ETF holdings are all adding pressure on family offices and prop shops to finally capitulate on their length.”
Meanwhile, on the day, data showed that Gross Domestic Product in the US fell at an unrevised 0.6% annualized rate in the second quarter. In other data, Initial Jobless claims for state unemployment benefits dropped to 193,000, versus expectations of 215,000 applications for the latest week.
Gold technical analysis
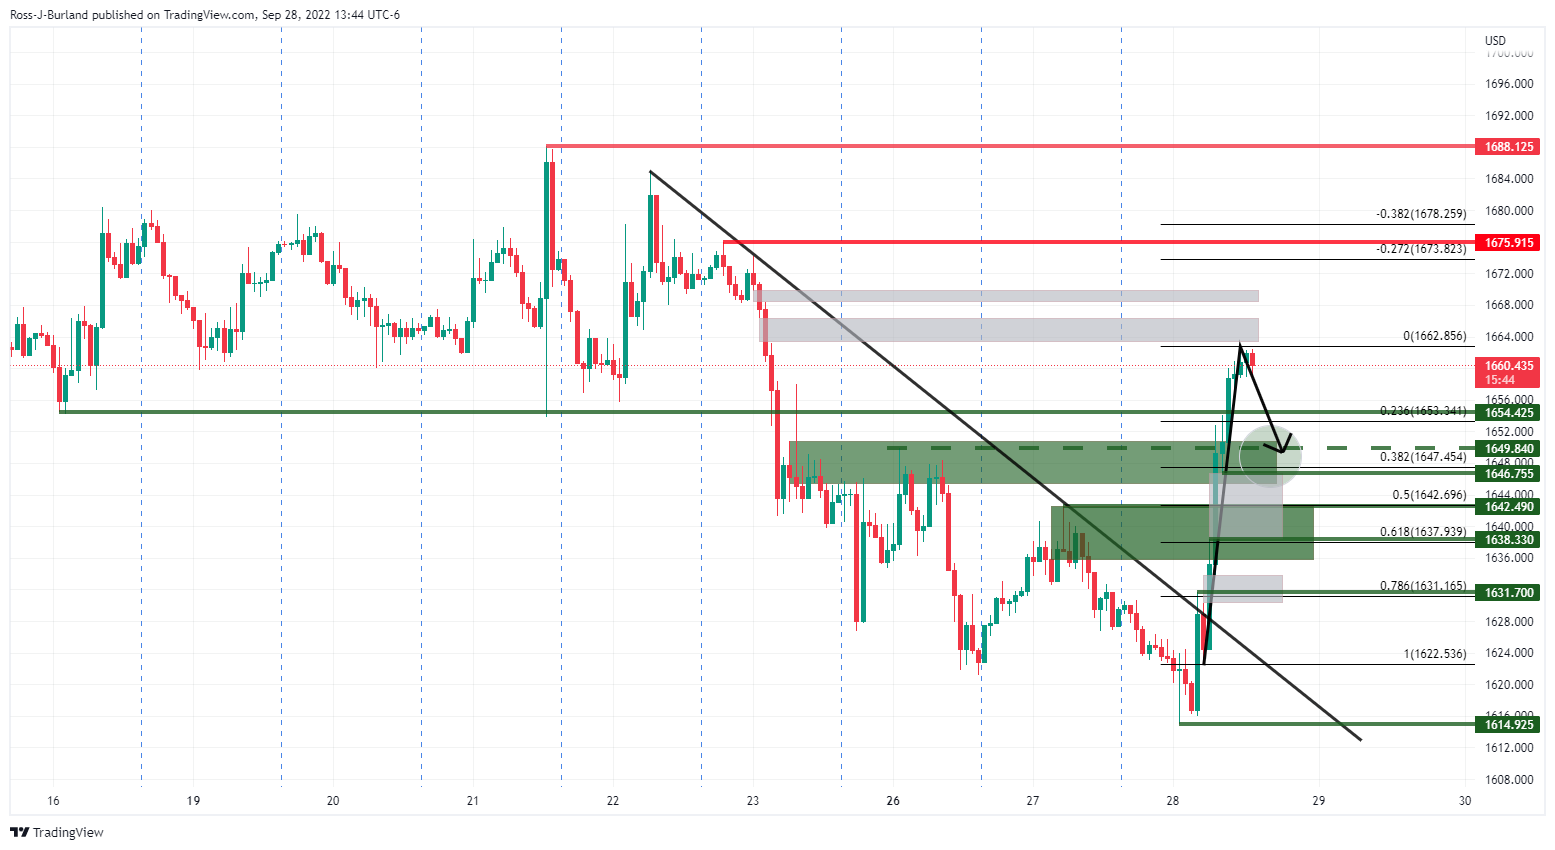
As per the prior analysis, Gold Price Forecast: XAU/USD bulls bounce back to life as US dollar gets slammed, the price has continued higher and there could be more to come from the gold bulls before the week is out:
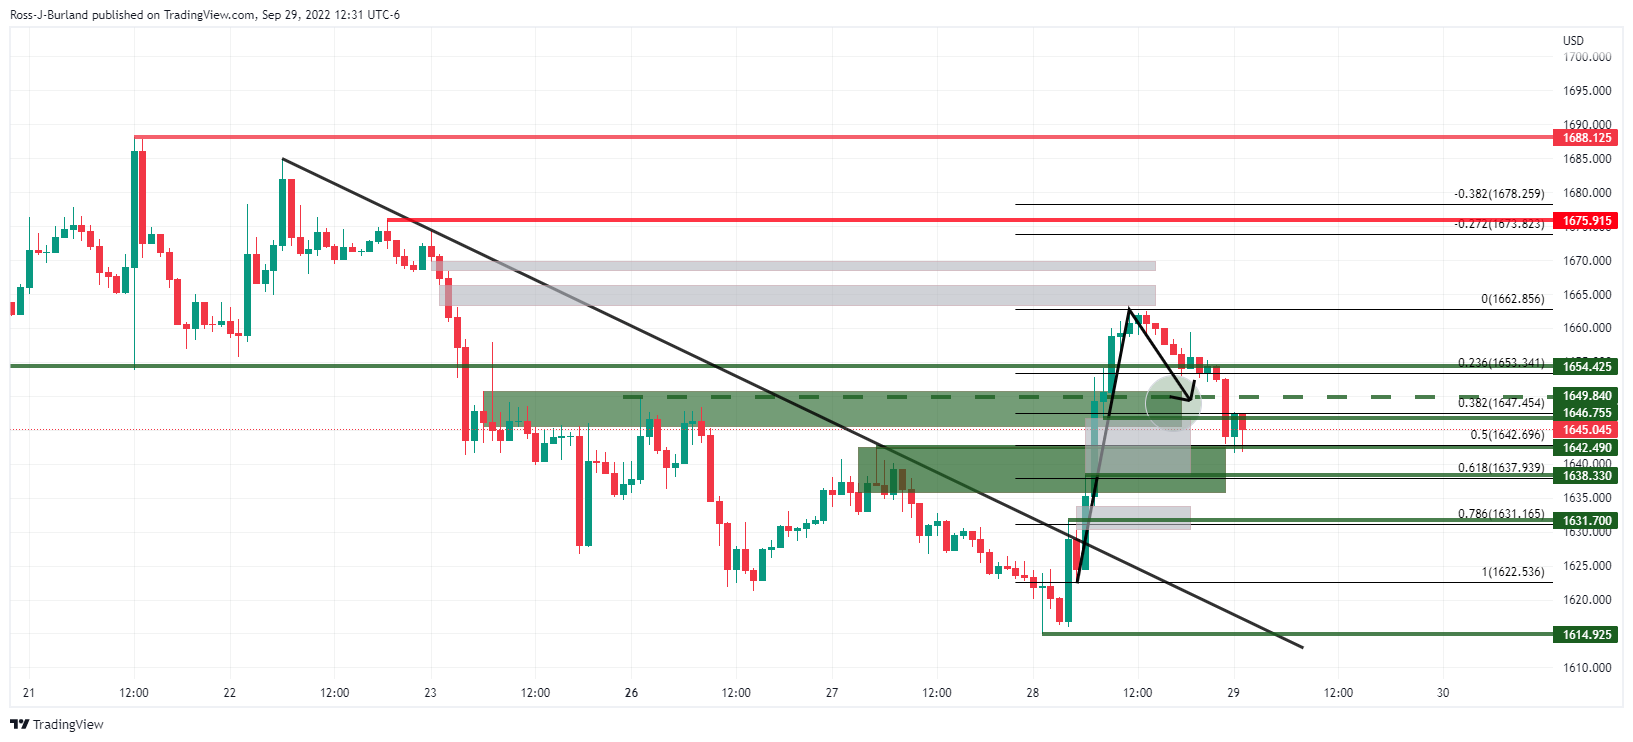
In the prior analysis above on the hourly chart, the price was expected to correct to Monday’s highs will have a confluence with a 38.2% Fibonacci level that guarded the price imbalances:
We have seen this play out as shown above.
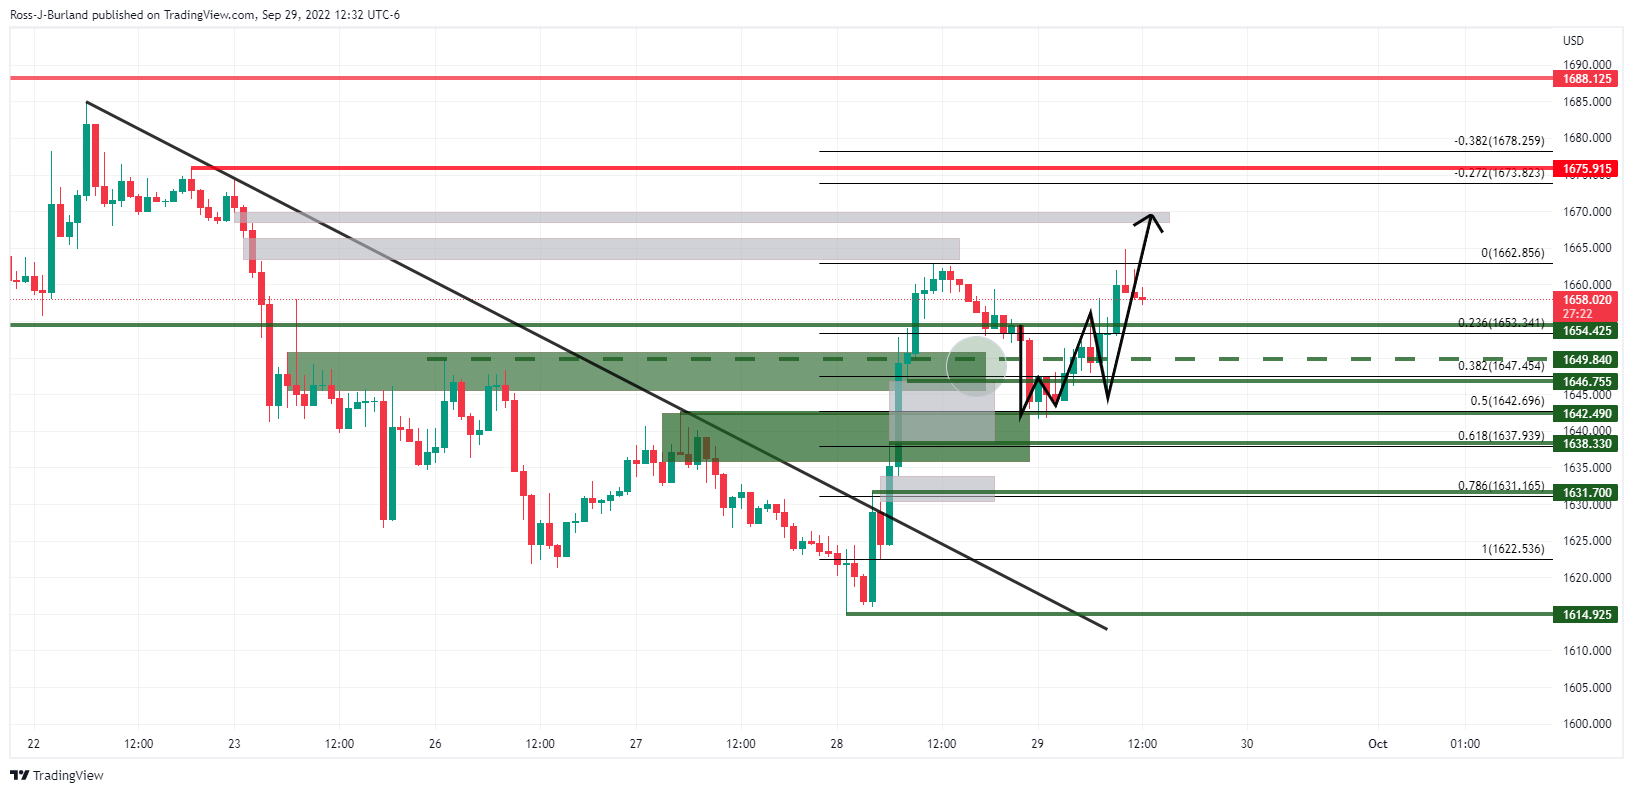
Meanwhile, the price then went on to make a W-formation that led to a continuation after the retest of the neckline, which is a typical scenario in the hourly W and M formations. They tend to act as reversion patterns and if the neckline holds, then a continuation can be expected. Traders can seek out optimal entries on the lower time frames, such as the 15 or 5 min charts in anticipation of a continuation trade:
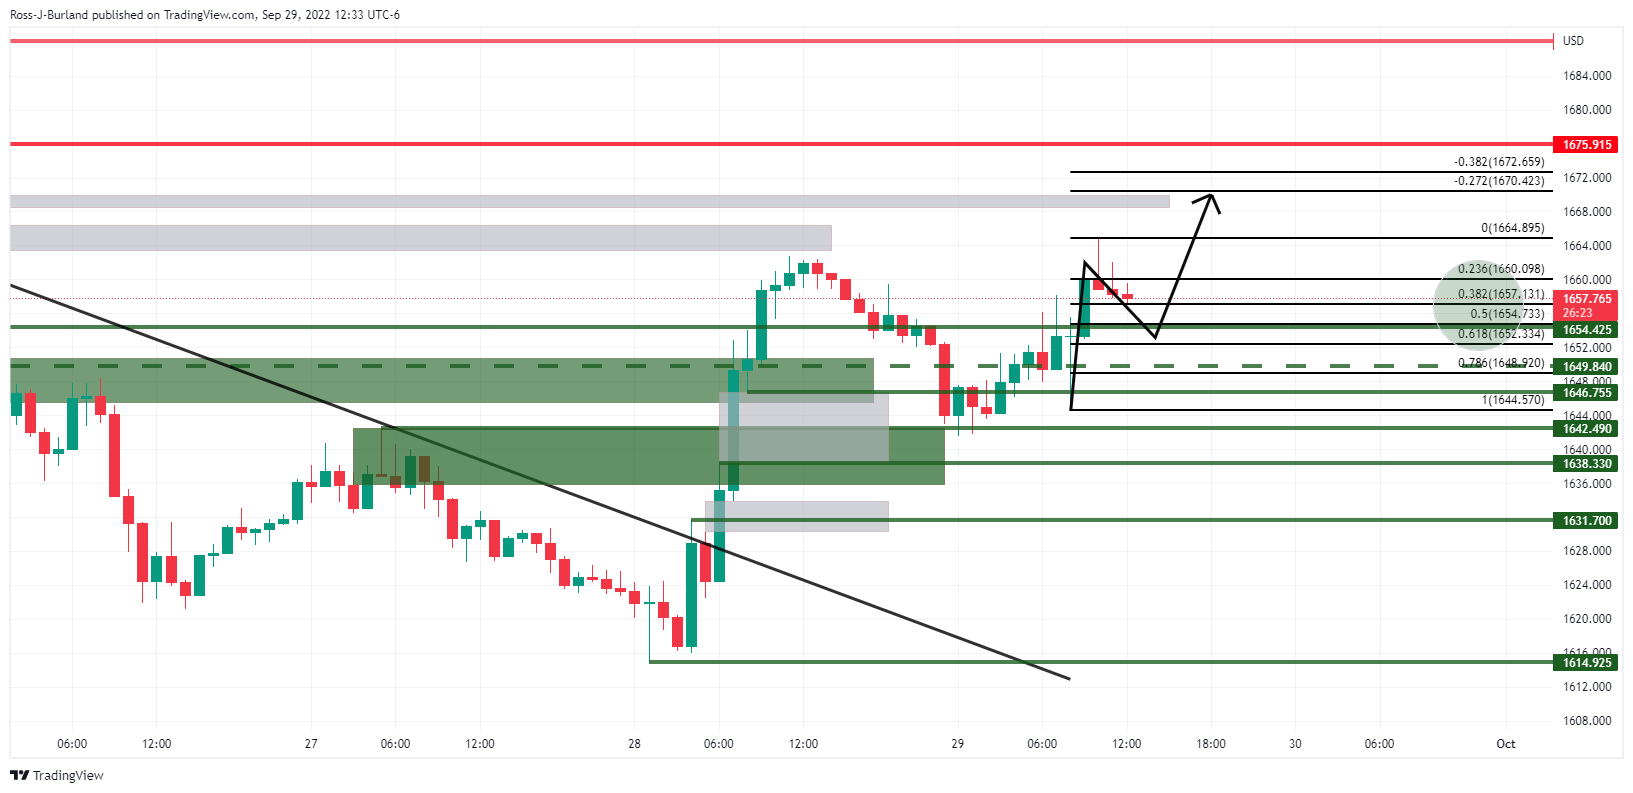
Meanwhile, the price is correcting again and the Fibonaccis drawn on the latest bullish impulse are targeted. If support holds, then a continuation of the bullish trend would be anticipated for the forthcoming month-end sessions. The greyed area is a price imbalance that would be subsequently mitigated at around $1,670 guard $1,675 and $1,688:


