Products You May Like
- GBP/JPY registered hefty gains of 3.96% during the week.
- Long-term, the GBP/JPY is neutral upwards, though if it clears 162.57, that could open the door for further gains.
- Per the daily chart, if the GBP/JPY clears 162.25, the pair can rally towards 164.00.
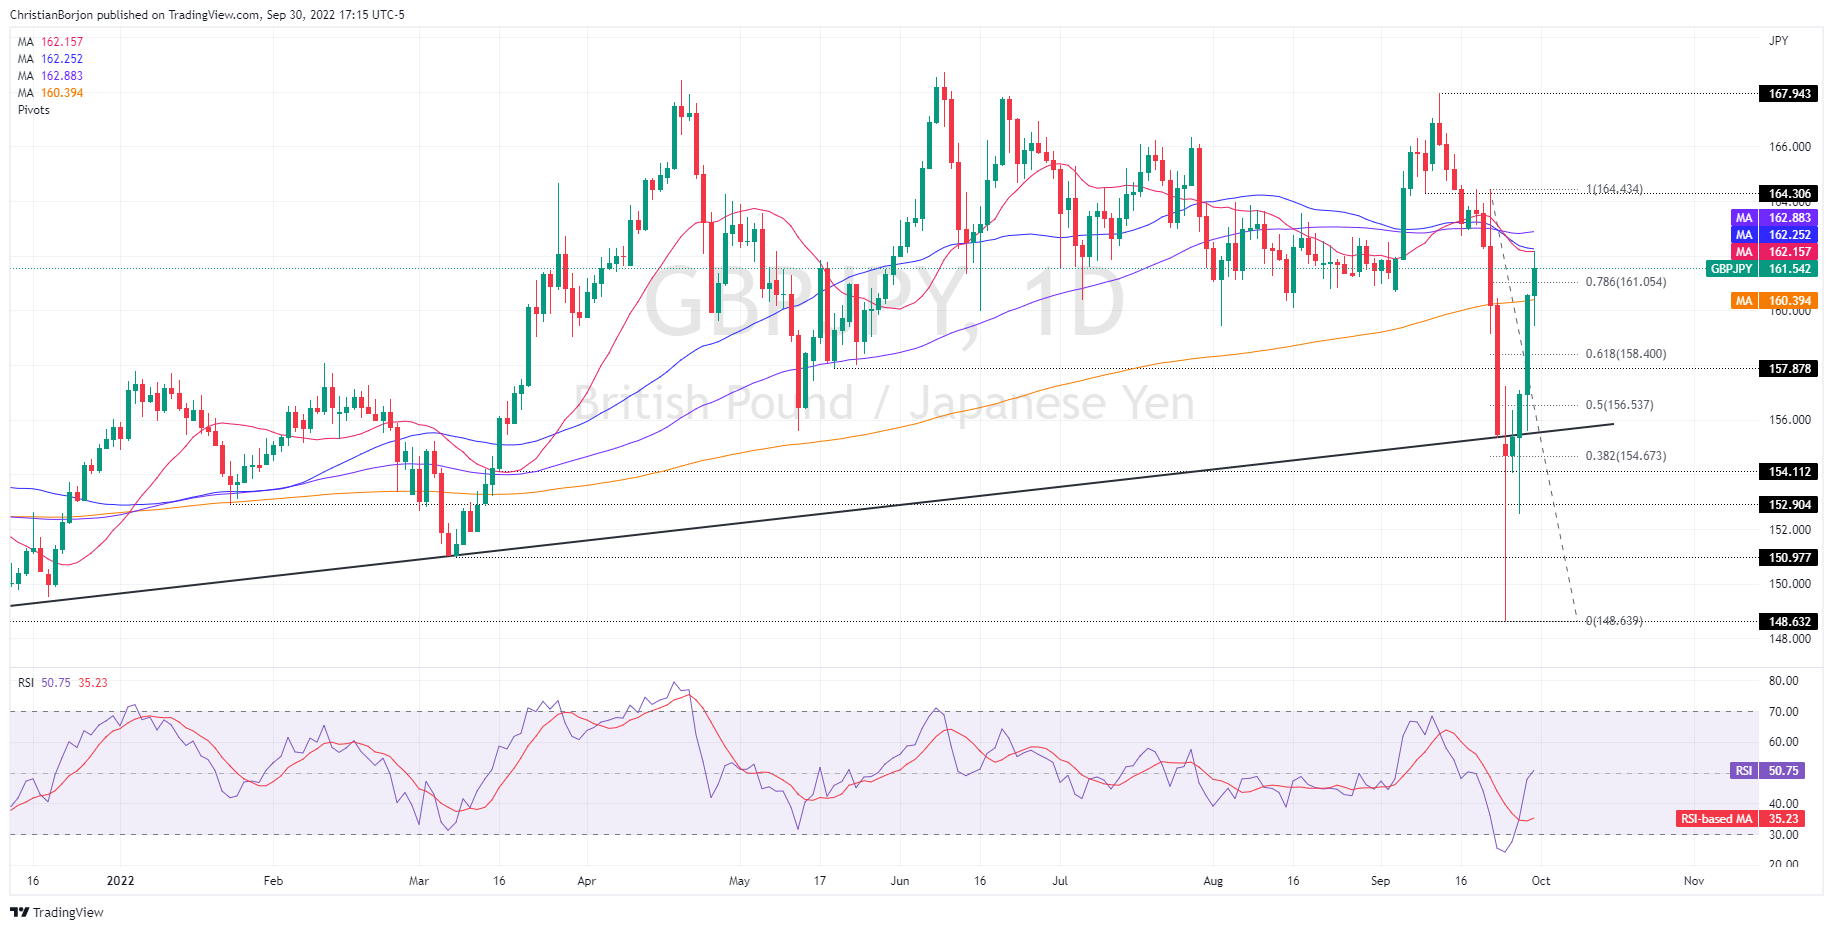
The GBP/JPY advanced for the fourth straight day and reclaimed the 200-day EMA after hitting a daily low at around 159.43, though buyers stepped, sending the cross-currency pair towards its daily high of 162.17. At the time of writing, the GBP/JPY is trading at 161.54, above its opening price by 0.62%.
GBP/JPY Price Analysis: Technical outlook
From a weekly chart perspective, the GBP/JPY is neutral-to-upward biased after a volatile trading week that witnessed the pound sliding towards a YTD low of 148.63 before recovering close to 1200 pips. GBP/JPY traders should be aware of oscillators shifting to positive territory. Therefore, a re-test of the 20-week EMA, around 162.57, is on the cards.
The GBP/JPY daily chart shows that Friday’s rally was capped at a “packed” supply zone, with the 20, and the 50-day EMAs hoovering around 162.15-162.25, ahead of the 100-day EMA at 162.88. Worth noting that, albeit solid resistance lie above, the GBP/JPY pierced the 78.6% Fibonacci retracement at 161.05, opening the door for further upside.
Therefore, the GBP/JPY first resistance would be the 162.00 figure. Once cleared it would expose the aforementioned 162.15-162.25 area, followed by the 100-day EMA at 162.88 ahead of the 163.00 mark. A breach of the latter will expose the September 22 daily high at 164.43.


