Products You May Like
- GBP/USD snaps three-day losing streak while recovering from two-month low.
- Bearish MACD, September 11 low can probe the pullback moves.
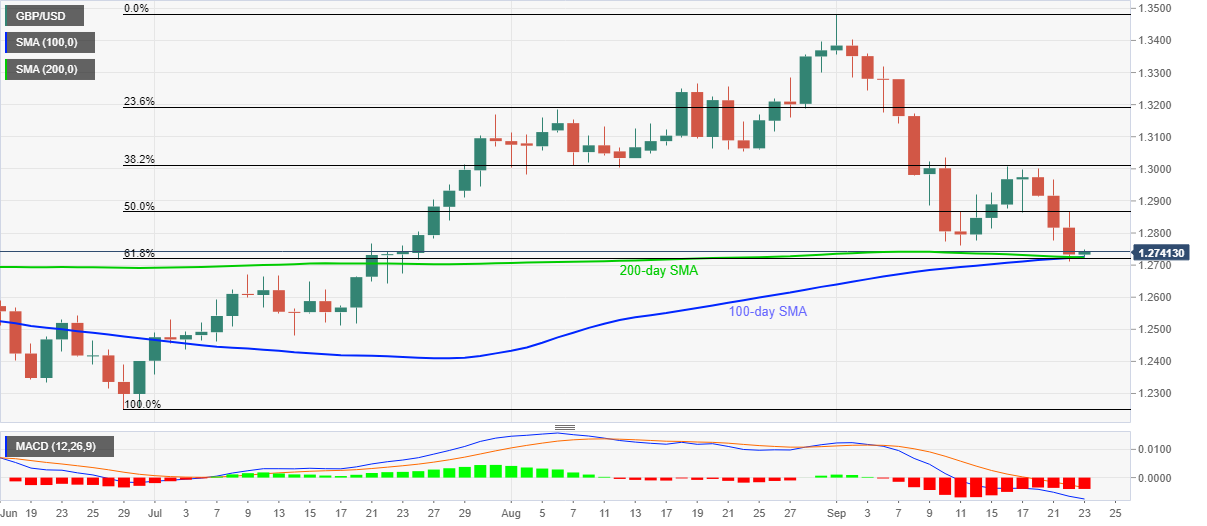
- 61.8% Fibonacci retracement joins 200-day and 100-day SMAs to restrict immediate downside.
GBP/USD extends recovery moves from 1.2710 towards attacking 1.2750, currently near intraday high of 1.2745, as markets in Tokyo open for Wednesday’s trading. The cable dropped to the lowest since July 23 the previous day but a confluence of the key SMAs and 61.8% Fibonacci retracement of its late-June to the early-September upside barred sellers afterward.
However, bearish MACD requires the buyers to cross the September 11 bottom of 1.2762 to extend the latest U-turn. In doing so, the 1.2800 threshold could become their next choice.
In a case where GBP/USD remains strong beyond 1.2800, the 50% Fibonacci retracement level of 1.2865 can probe the bulls ahead of directing them to September 16 peak surrounding the 1.3000 psychological magnet.
On the downside, the 1.2726/20 support confluence becomes the key to watch as a daily closing beneath the same can easily break the 1.2700 round-figure while targeting the early-July tops near 1.2660/65.
During the further weakness of GBP/USD, the July 14 bottom near 1.2480 will flash on the bears’ radar.
GBP/USD daily chart
Trend: Pullback expected


