
Products You May Like
Down 150 points or -1.25%
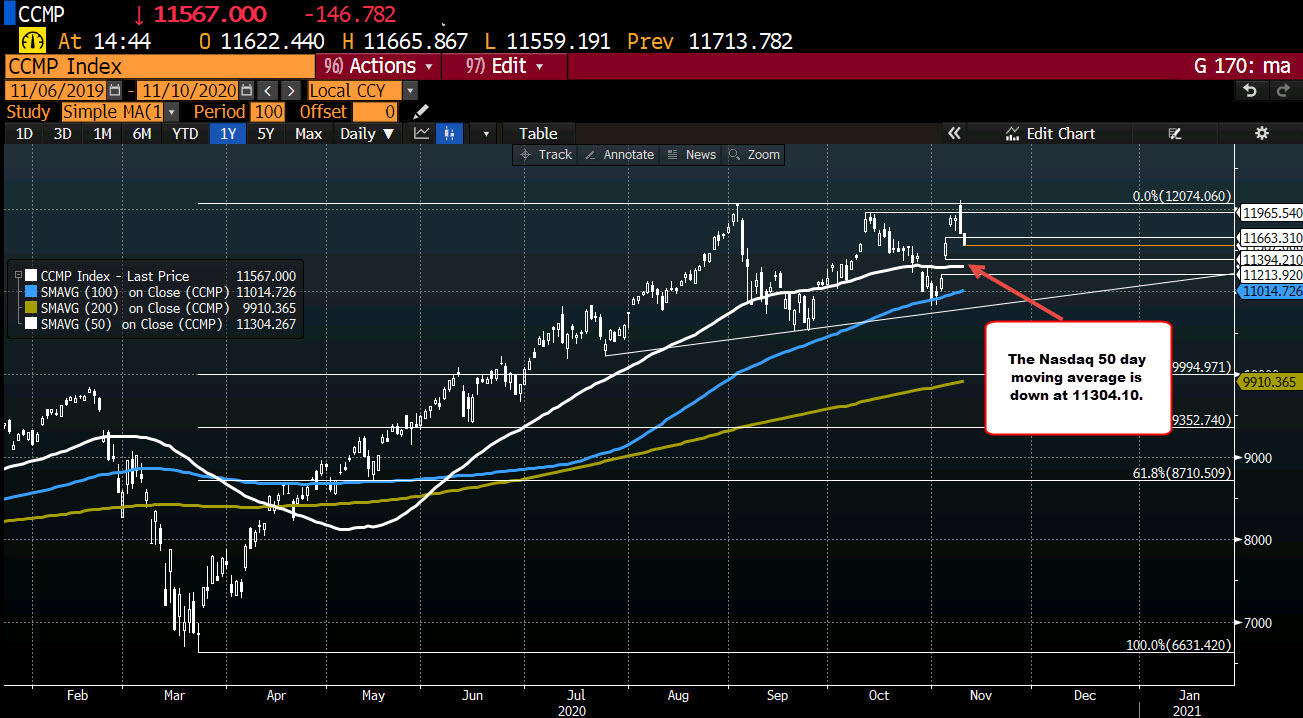
The NASDAQ index has continued its decline. It now trades down around 150 points or -1.26% at 11562. The high for the day reach 11665.86 the low has extended to 11559.19 so far.
Looking at the daily chart, the pair still remains above its 50 day moving average at 11304.622, in trading today filled the gap from Wednesday’s to Thursday’s trade. There was a another gap from Tuesday to Wednesday on the daily chart.
This article was originally published by Forexlive.com. Read the original article here.