Products You May Like
- The price of gold has broken into bearish territory below a 38.2% Fibonacci retracement.
- Bears will seek a discount on a pullback to retest old support, expected to turn resistance.
In the recent good news in markets, the price of the yellow metal has come under renewed pressure.
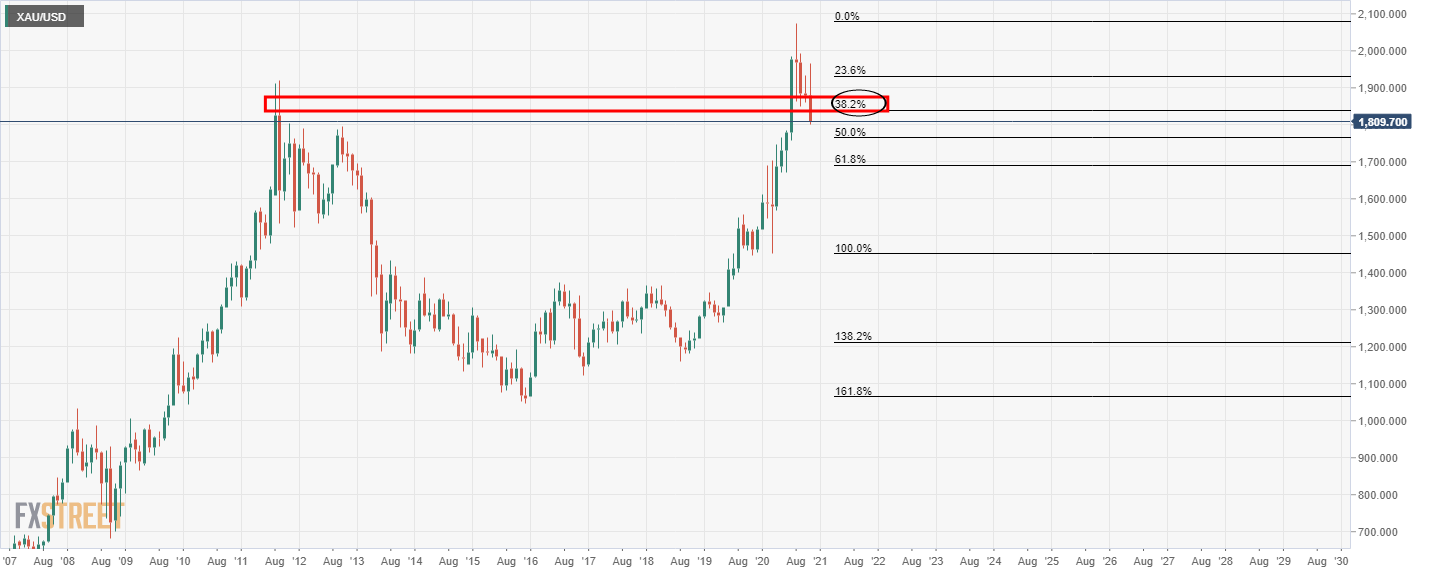
The yellow metal has completed a 38.2% Fibonacci retracement of the weekly bull trend and has closed below the level on a daily basis.
The following is a top-down analysis which illustrates where the next opportunity could be on a retest of an old support structure.
Monthly chart
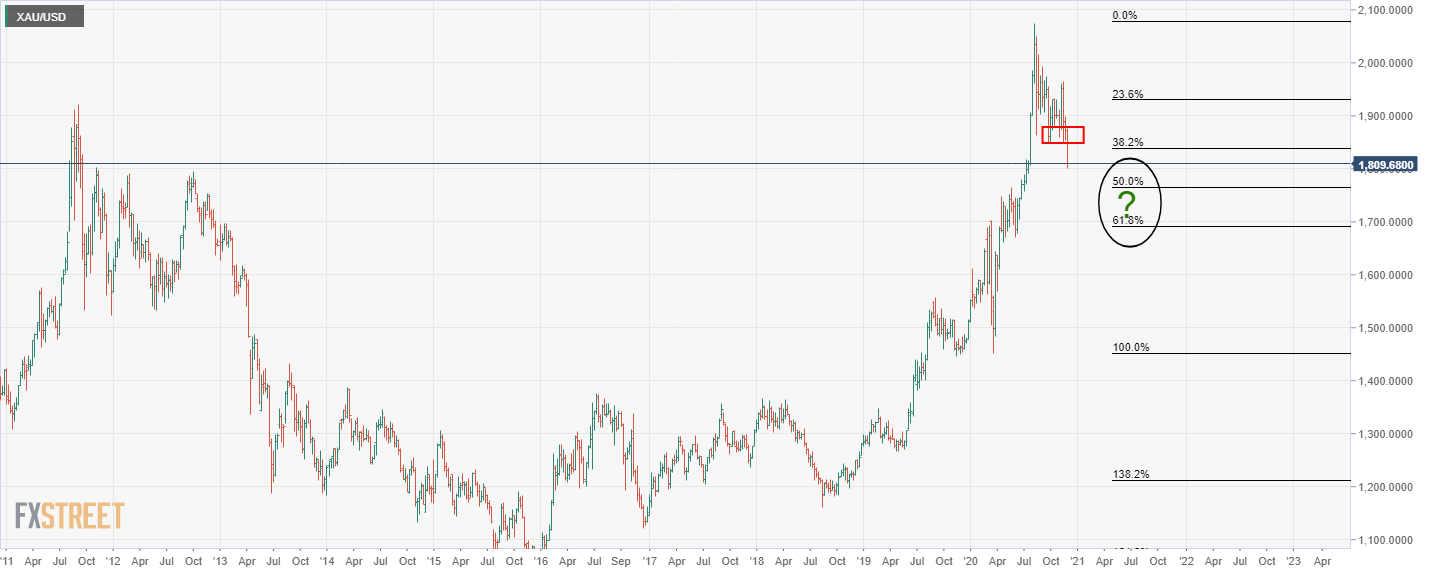
Weekly chart
Does the correction have the legs to test the old resistance and confluence of either the 50% or 61.8% Fibonacci retracement areas?
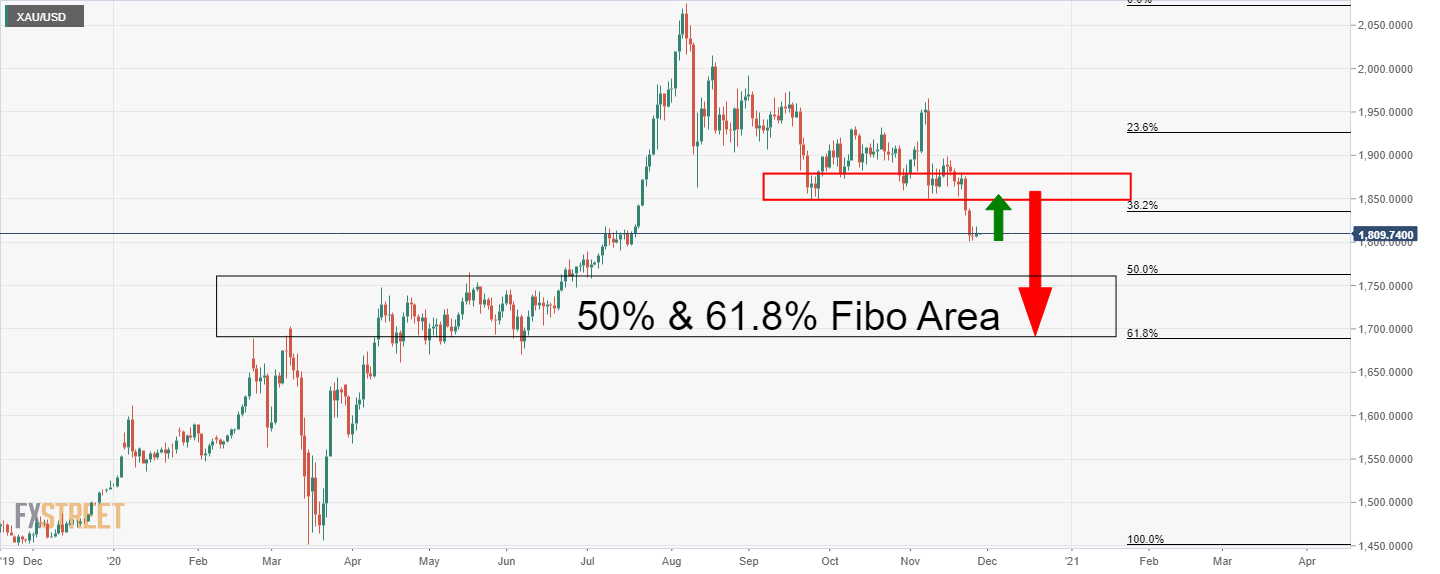
Daily chart
As can be seen, the bulls may well be seeking a retest of the old support. If this area holds, then bears will be encouraged to risk positioning towards the next target area.
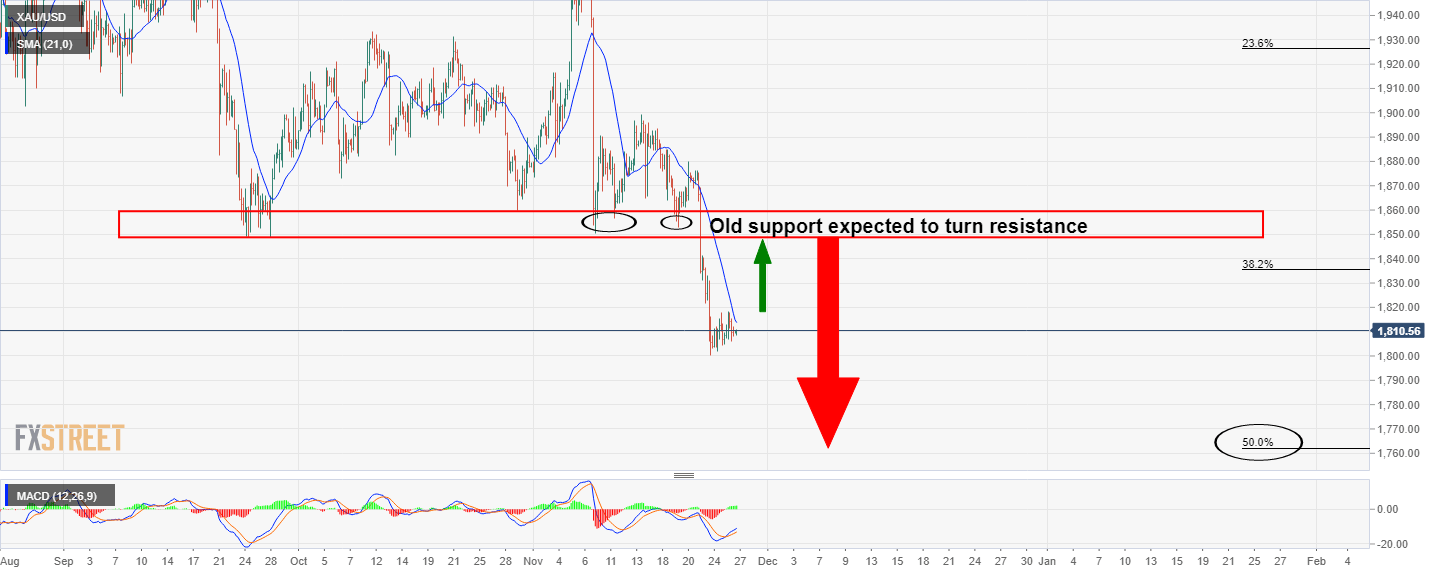
4-hour chart
As it stands, the price remains in bearish territory, but a break of the 21 moving average on the 4-hour time frame will open prospects of a test of the old support.


