
Products You May Like
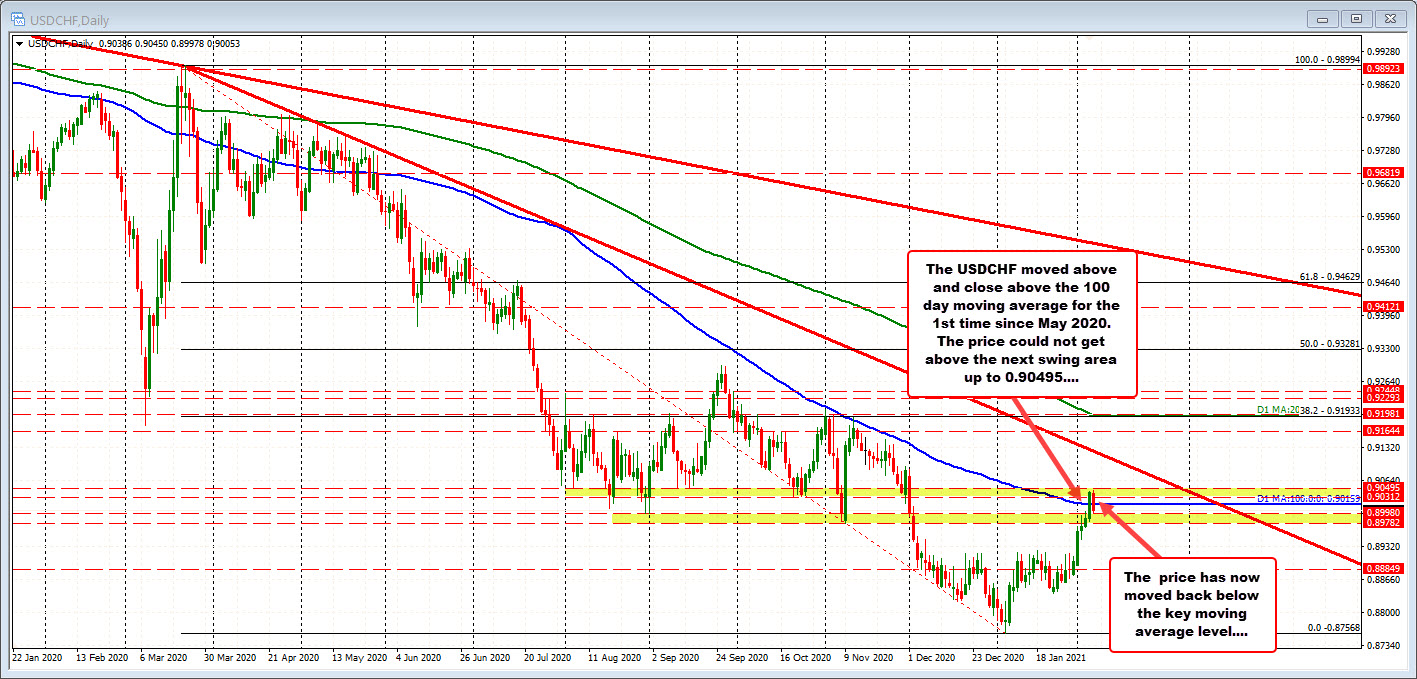
First break above 100 day moving average since May doesn’t go so well
The USDDCHF moved above its 100 day moving average (and closed above) in trading yesterday. That was the 1st close above the level since May 25. However the break didn’t go so well. We are currently trading back below that moving average line. The 100 day moving average comes in at 0.90159.
Drilling to the hourly chart, the move to the downside as the price looking toward its 100 hour moving average at 0.89952. That is the next key target to get to and through if the sellers are to take back more control. That level also corresponds with the swing high from Tuesday’s trade (at 0.89939).
If the sellers are to take more control, getting below that moving average level and the 38.2% retracement of the move up from the January 29 base is required. That 38.2% retracement comes in at 0.89794. It is near the low level from yesterday and a swing low from Wednesday’s trade as well (see red numbered circles).
This article was originally published by Forexlive.com. Read the original article here.