Products You May Like
- NZD/USD bulls are looking to the daily Fibos for a meaningful test of daily resistance.
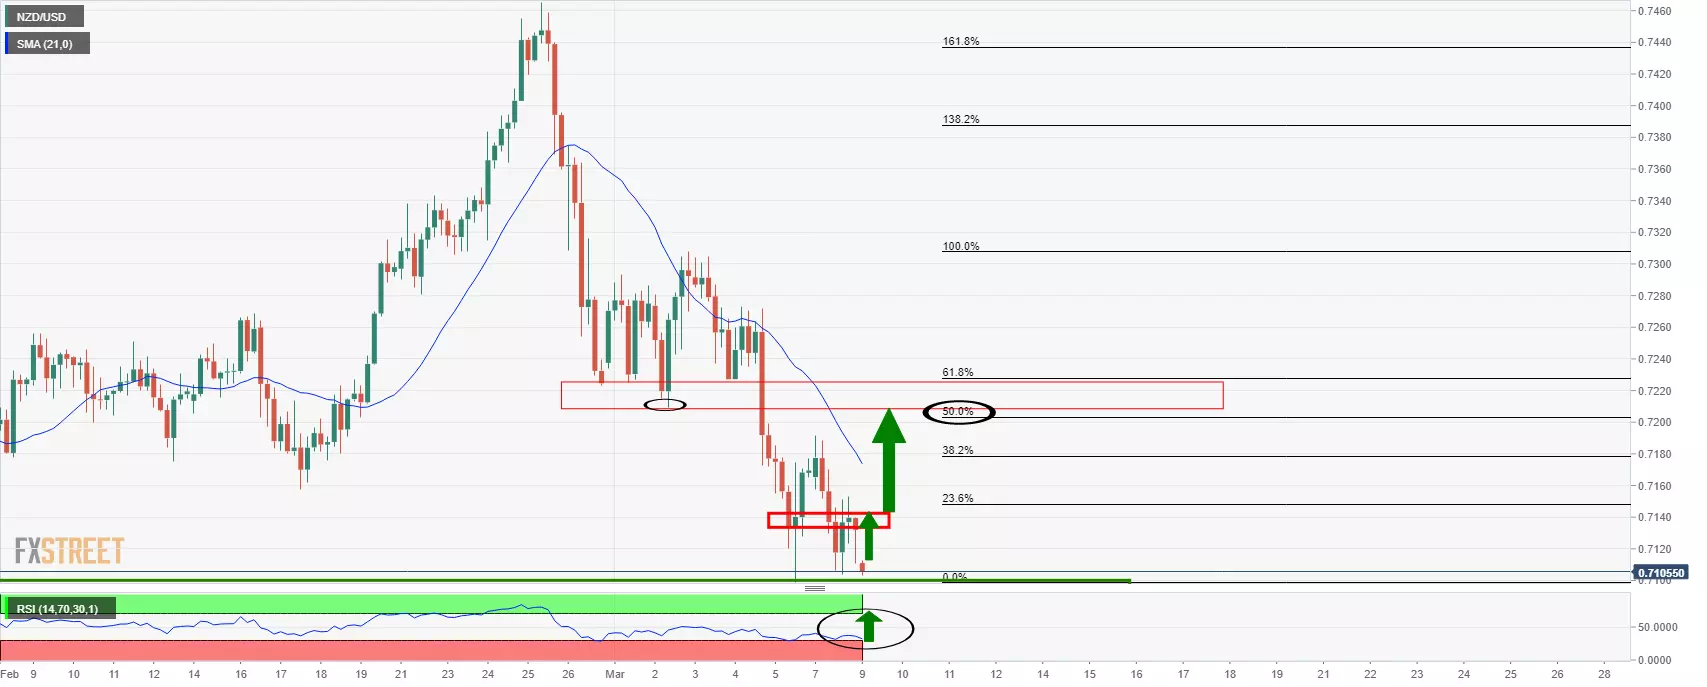
- Hourly oversold conditions and a break of resistance will expose the daily 50% mean reversion level.
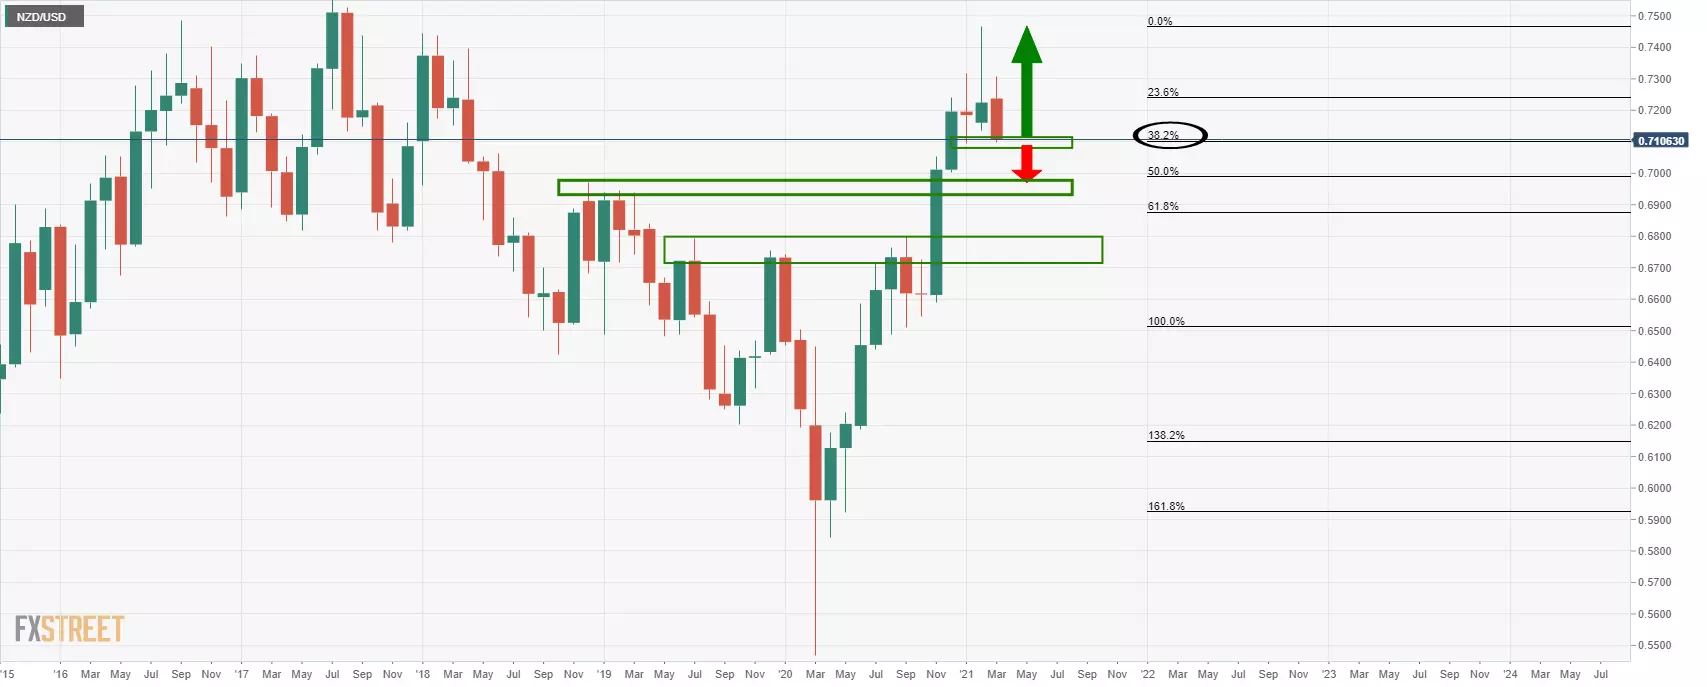
The price of NZD/USD is sitting at a monthly support level that meets a 38.2% Fibonacci retracement level as additional confluence.
At this juncture, the price would be expected to continue higher within the bullish trend.
The following is a top-down analysis that illustrates where the next trading opportunity could evolve from on the lower time frames.
Monthly chart
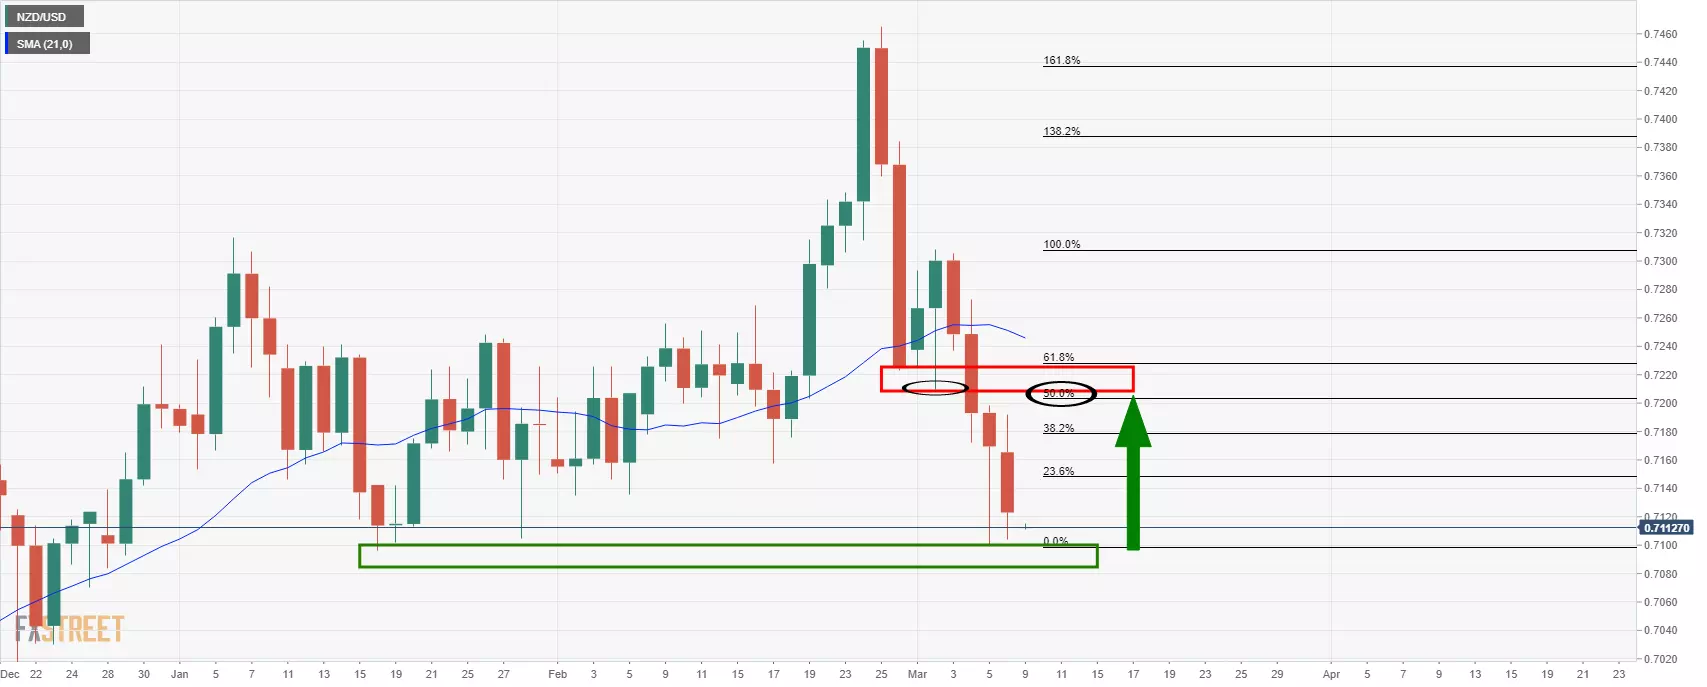
Daily chart
The bulls have a clear target back to the old support in a 50% mean reversion.
1-hour chart
The oversold conditions are ripening the price for a break of the immediate resistance. A break there will expose the daily target.
This article was originally published by Fxstreet.com. Read the original article here.


