
Products You May Like
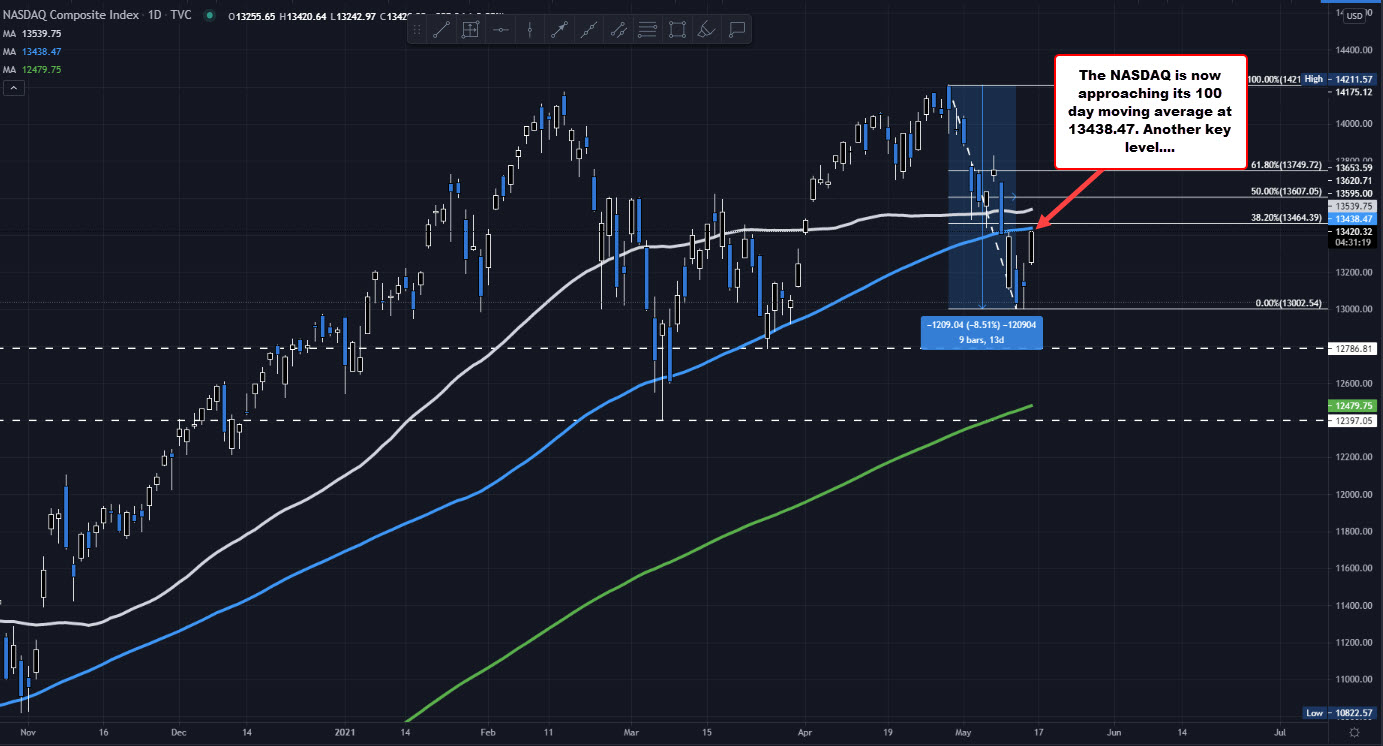
100 day MA is at 13438.47 currently
The NASDAQ index continues its move to the upside and is currently trading up over 300 points or 2.3% at 13428.03 (that is the high). The last move to the upside took the price back above its 50 hour moving average currently at 13407. The next target comes in at the 100 day moving average which is at 13438.47 currently.
Recall that on Monday, the price closed just below that moving average level, and stayed below the moving average for the rest of the week. On the 5th day, the index is back up retesting the key MA level. Getting and staying above the MA would tilt the buyers more to the upside.
PS The last time the price closed below the 100 day moving average for four consecutive days was back in April 2020 – over 1 year ago.