Products You May Like
Chicago Fed national activity index for April 2021
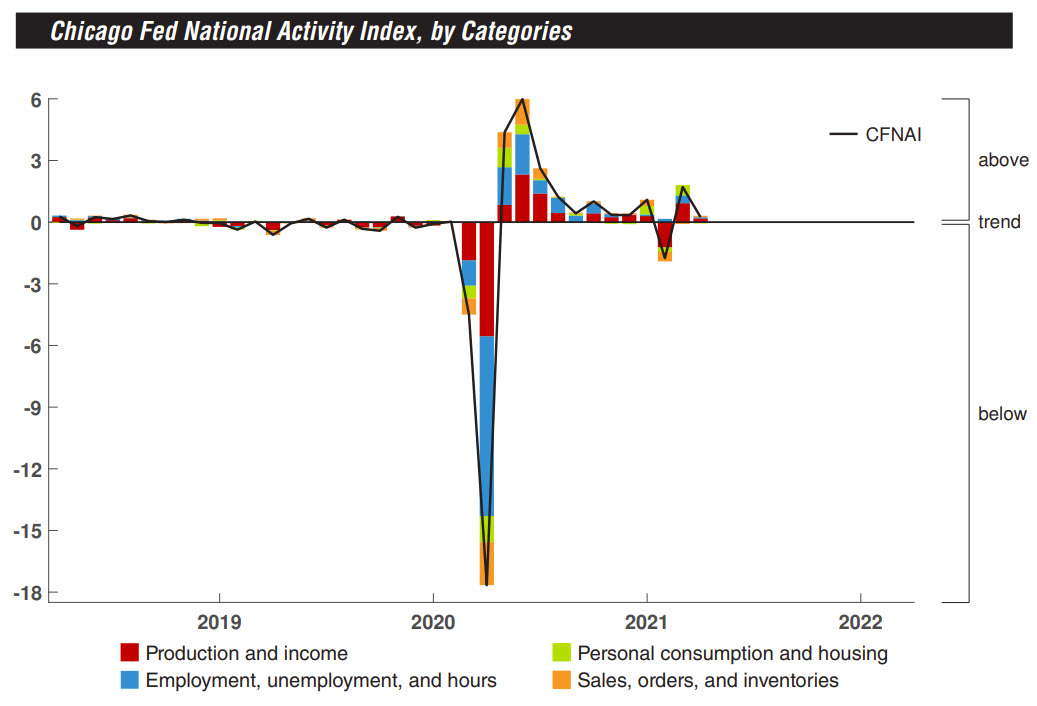
- Chicago Fed national activity index for April 2021 0.24 versus 1.0% estimate. The index fell from 1.71 in March.
- 3 of the 4 broad categories of indicators used to construct the index made positive contributions in April. However, three categories deteriorated from March
- The three month moving average decreased to 0.07 enable from 0.35 in March.
- 47 of the 85 indicators made positive contributions, while 38 may negative contributions
- 24 indicators improved from March to April
- 60 indicators deteriorated and one was unchanged
- of the indicators unproved, 10 made a negative contributions
- production, +0.18% versus +0.92% March
- personal consumption and housing category, -0.06 versus +0.50 in March.
- Employment, unemployment and hours category came in at 0.05 in April down from 0.38 in March
- sales, orders, and inventories rose 0.07 in April from -0.09 in March
The Chicago Fed national activity index is a weighted average of 85 existing monthly indicators of national economic activity. A positive index reading corresponds to growth above trend and a negative index reading corresponds to growth below trend. The 85 economic indicators that are included in the CFNAI are drawn from four broad categories of data: production and income; employment, unemployment, and hours; personal consumption and housing; and sales, orders, and inventories.
The CFNAI was constructed using data available as of May 20, 2021.
At that time, April data for 51 of the 85 indicators had been published. For all missing data, estimates were used in constructing
the index. The March monthly index value was unrevised at +1.71,
and the February monthly index value was revised to -1.75 from
last month’s estimate of -1.20.

