Products You May Like
- EUR/USD bounces off early April lows, refreshes intraday high of late.
- RSI recovery from oversold area backs bullish chart pattern’s confirmation.
- Previous support line, 200-HMA adds to the upside filters.
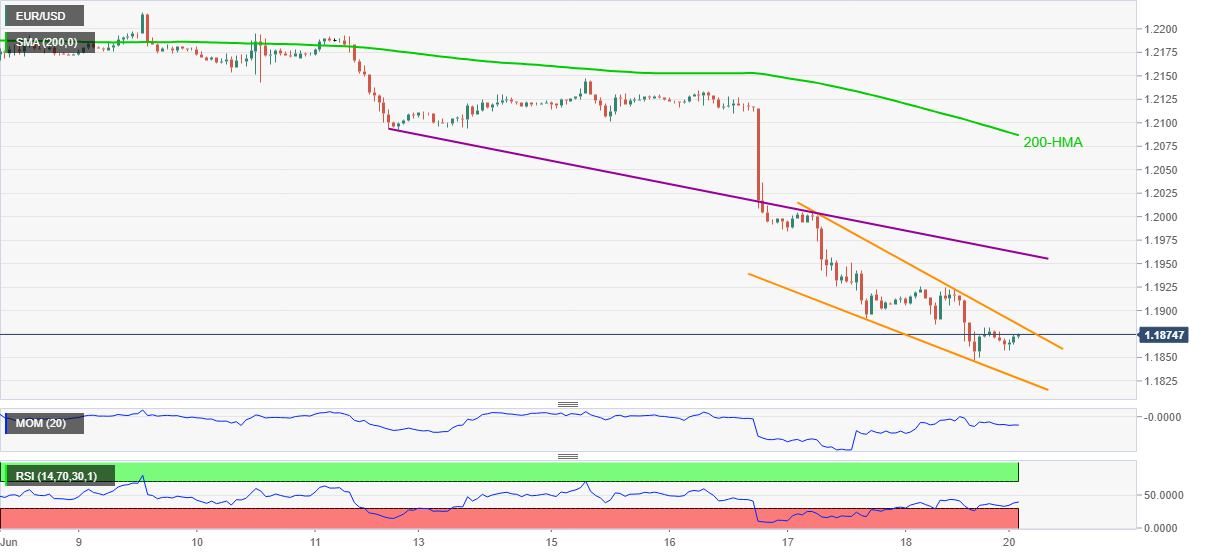
EUR/USD extends late Friday’s recovery towards 1.1900, up 0.10% around 1.1875, during Monday Asian session. In doing so, the currency major portrays a bullish chart pattern, falling wedge, near the lowest levels since April 08.
Given the RSI’s U-turn from oversold territory gaining support from the strong Momentum line, EUR/USD may extend the corrective pullback towards the 1.1900 threshold. However, the stated formation’s resistance line near 1.1885 becomes an immediate hurdle to cross.
Although falling wedge breakout gains momentum near the multi-day low, if broken, a descending resistance line from June 11 near 1.1960 could probe the bulls holding the theoretical target over the 1.2000 psychological magnet. It’s worth noting that the EUR/USD buyers will remain cautious unless witnessing a clear break of the 200-HMA level around 1.2085.
Alternatively, the recent low near 1.1850 and the stated pattern’s support line close to 1.1825 could test the pair sellers during the fresh downside.
In a case where EUR/USD bears keep the reins below 1.1825, the 1.1800 round figure and the yearly bottom near 1.1705 will be on their radars.
EUR/USD hourly chart
Trend: Further recovery expected


