Products You May Like
- NIO shares drop on Monday despite gains for equity indices.
- NIO still trending nicely holding short term moving averages.
- NIO possibly hurt as sector leader Tesla falls on Bitcoin woes.
NIO continues its impressive run of form shown since bottoming out in the middle of May. NIO and most Chinese electric vehicle manufacturers have been on a run of late as some impressive delivery numbers hit the tape in early June providing a further catalyst for share appreciation.
NIO was charged up and ready for a drive higher on the back of some strong data in early June. Delivery data was strong and Citi said “expect NIO’s monthly new order volumes in May-Jun[e] to be 20-30% higher than the average monthly level in 4Q20 peak season.” Citi also mentioned it could see a 50% upside in the shares. LiAuto (LI) chimed in with its own strong numbers as deliveries of the company’s Li ONE model rose by 101% YoY. Xpeng (XPEV) CEO Brian Gu said, “We are on track to meet or exceed second-quarter delivery numbers, which I think means Chinese EV demand is still very strong.” All in all, there is plenty of positive news flow for the Chinese electric vehicle sector.
NIO statistics
| Market Cap | $73.6 billion |
| Enterprise Value | $56 billion |
| Price/Earnings (P/E) | -137 |
|
Price/Book |
17 |
| Price/Sales | 23.5 |
| Gross Margin | 15% |
| Net Margin | -36% |
| EBITDA | -4.6 b Yuan |
| Average analyst recommendation and price target | Buy $52.89 |
NIO stock forecast
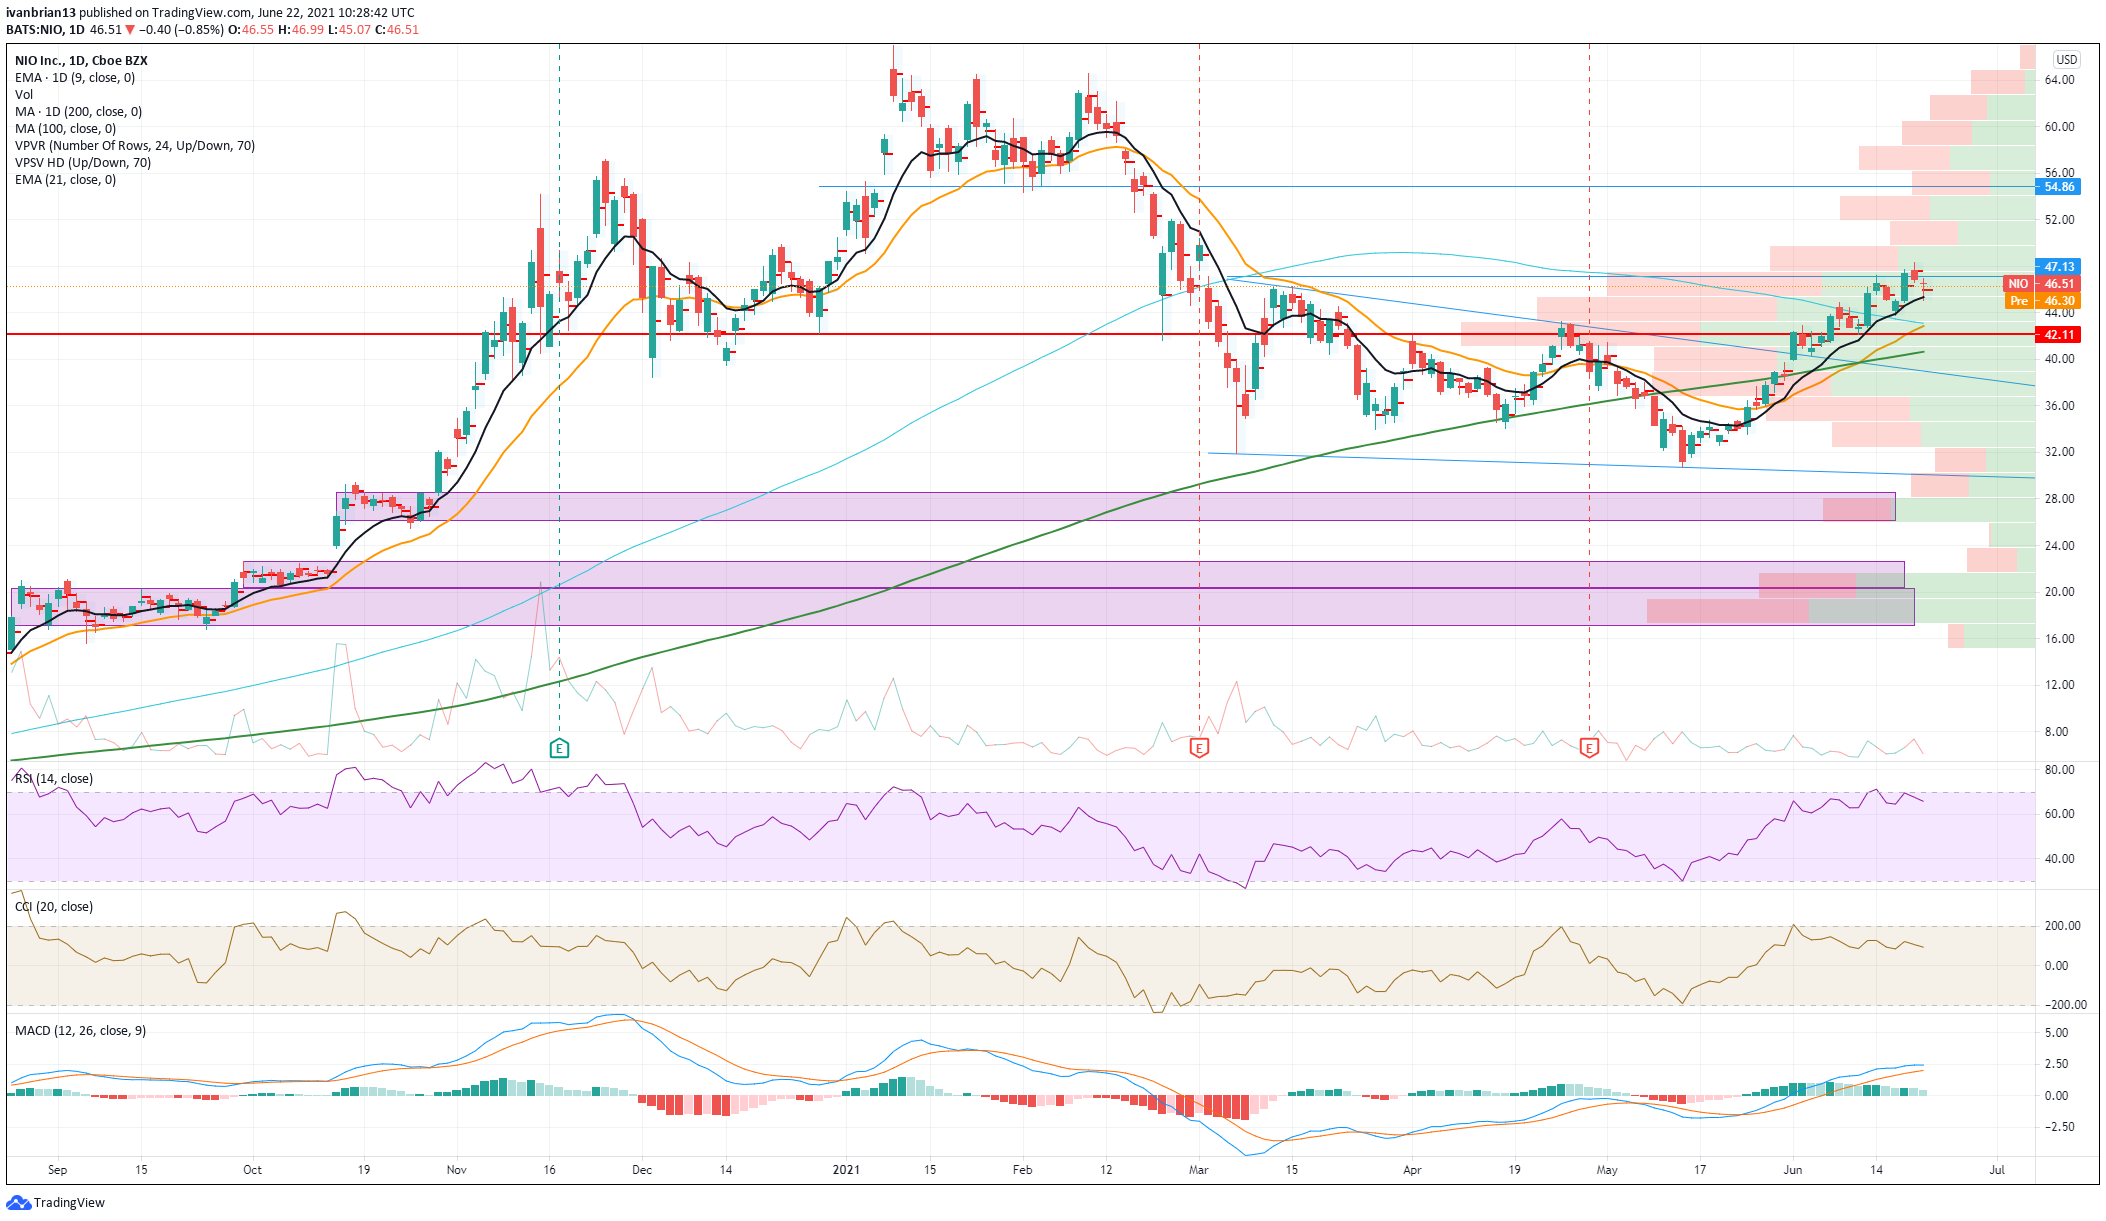
Monday saw NIO shares give up some recent ground but the strong run is still held in place by the 9-day moving average. Monday’s low of $45.07 found support at the 9-day moving average and so kept the short-term bullish trend in place. The chart below shows just how well this moving average has been holding the upmove so is an important level to watch. The resistance at $47.13 was briefly broken but nothing sustained so this remains the short-term target. This is the entry of the wedge formation in place since March and a break is another bullish sign. Above that, the next resistance level is at $54.86. The volume profile on the right of the chart shows just how quickly it dries up so breaking here could and should see a price acceleration.
Key support remains at the 9-day moving average and a break will turn the risk-reward neutral. For now, it remains skewed for further gains but only modestly. Small long positions can be tried at the key moving averages but use a tight stop as this remains a volatile stock. The big move from the wedge breakout has already happened, so don’t chase it, wait for the next opportunity. If you are long from the breakout, use a trailing stop. Any break lower and nothing interesting for initiating long positions arrives until the 200-day moving average at $40.66. Long-term support zones are highlighted in the purple boxes, first one at $28.
Like this article? Help us with some feedback by answering this survey:


