Products You May Like
- USD/ZAR rebounds, looks for more upside amid USD’s bounce.
- The spot set for a triangle breakout on the 1D chart, as it probes 100-DMA.
- 21-DMA is the level to beat for the bears but the RSI remains bullish.
Having found strong support near 14.20 once again, USD/ZAR is attempting a rebound towards 14.50.
This comes as the US dollar tries to find its feet amid a risk-off market profile, as the Delta covid variant concerns and China’s likely slowdown in the economic recovery weigh on the market mood.
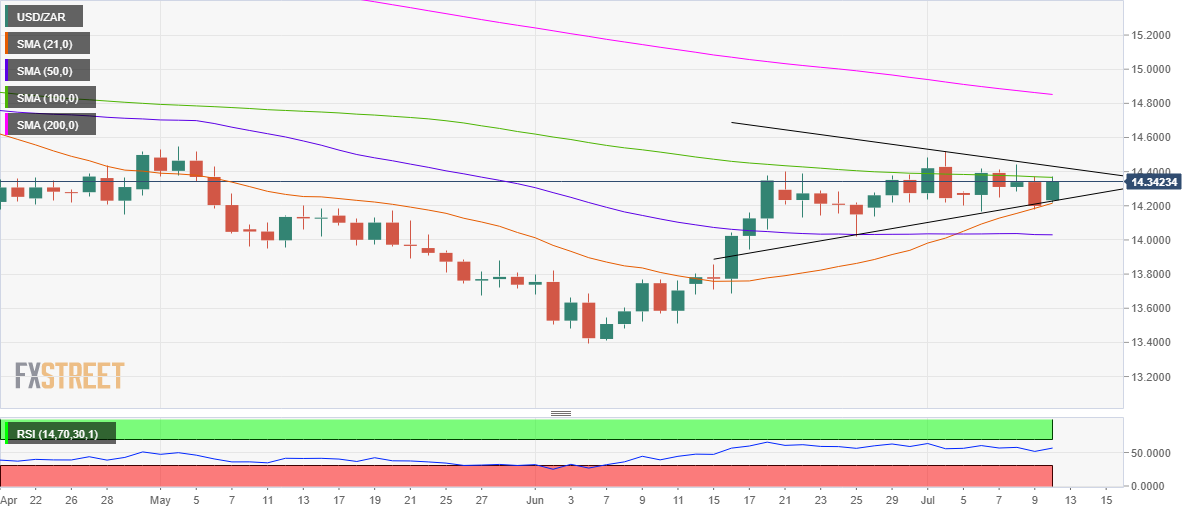
From a near-term technical perspective, the cross is looking to recapture the 100-Daily Moving Average (DMA) at 14.37 on a sustained basis, as it tries to extend its recovery from the rising trendline support at 14.22. At that level, the bullish 21-DMA coincides.
On rejection at the 100-DMA barrier, the abovementioned supported could be retested. A symmetrical triangle breakdown will materialize on a daily closing below 14.22.
The downward-sloping 50-DMA cap at 14.03 could then come to the rescue of the bulls.
USD/ZAR daily chart
However, with the 14-day Relative Strength Index (RSI) pointing north above the midline, the bulls are likely to extend their control going forward.
Acceptance above the 100-DMA could threaten the triangle resistance at 14.43, above which the buyers will aim for the July 2 high at 14.51, as it would lead to an upside breakout.


