Products You May Like
- XAG/USD is steady as the US 10-year T-bond yield sits firmly around 1.61%.
- The US Dollar Index seems poised to close above 94.00 for the second consecutive week.
Silver (XAG/USD) is advancing during the New York session, climbs 0.69%, trading at $22.76 at the time of writing. Price action throughout the American session has been swinging violently after the US Bureau of Labor Statistics (BLS) released the US Nonfarm Payrolls report, which revealed an increase of just 194K jobs, lower than the 500K foreseen by analysts.
The employment figure shows that there is slack left in the labor market, although the positive is that the Unemployment Rate fell from 5.1% to 4.8%. Furthermore, investors’ reaction seems to align with what Federal Reserve Chairman Jerome Powell said at the September meeting. He said that he needed a reasonably good jobs report to begin the bond tapering process.
The risk-off appetite portrayed the market reaction. US stock indices, instead of climbing, fell, the US T-bond 10-year yield rose to 1.61%, and the US dollar clung to 94.11, lost 0.11% against a basket of six peers.
XAG/USD Price Forecast: Technical outlook
1-hour chart
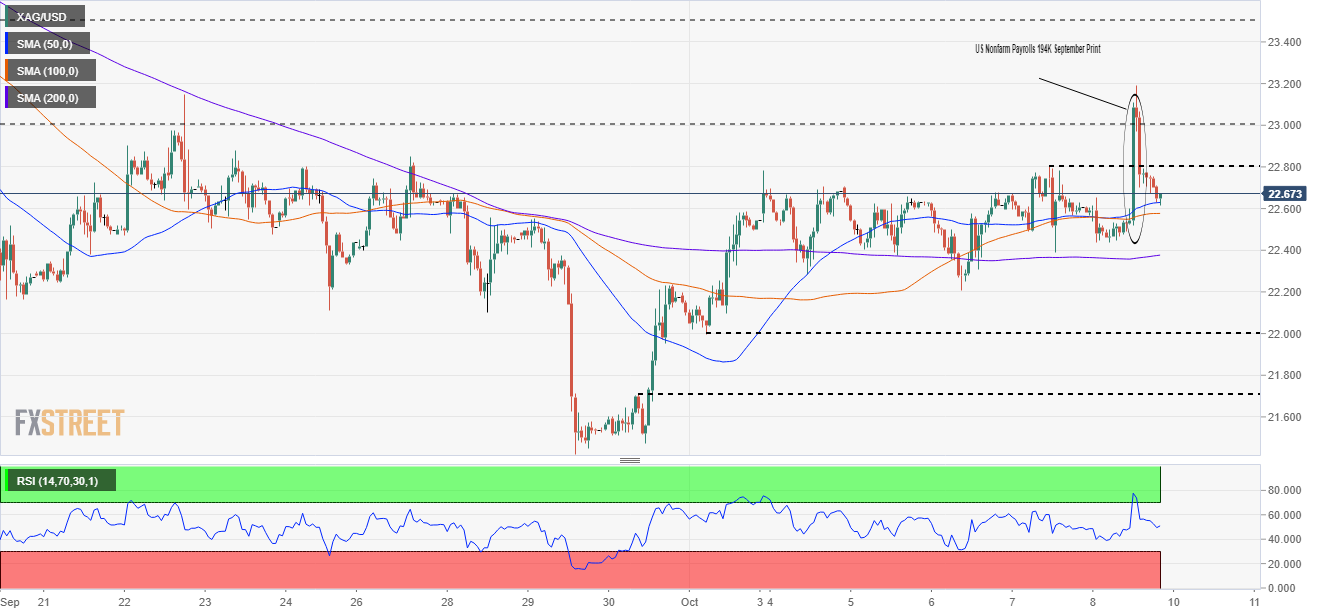
XAG/USD is trading above the simple moving averages, suggesting that silver has an upside bias.
The price action once the Nonfarm Payrolls figure for September hit the wires, silver jumped aggressively towards the new daily high around $23.19, but as the report was dissected, the knee-jerk reaction faded, retreating towards familiar levels around the 50-SMA at $22.63
For silver buyers to resume the uptrend, they will need to break above $23.00. in case of that outcome, the first supply zone would be the high of October 8 at $23.19. A break of the latter would expose the September 14 swing lows around $23.50, followed by the psychological $24.00.
On the other hand, for XAG/USD sellers to regain control, they need to reclaim the 200-SMA at $22.36. Once that has been achieved, a fall towards 2021 lows of around $21.40 is on the cards. Nevertheless, there would be some crucial demand zones in the way, like the psychological round number $22.00, followed by $21.79.
The Relative Strength Index (RSI) is at 50, aiming slightly high, suggesting upside bias in the short-term, which could open the door for another leg up.


