

Products You May Like
- WTI pares intraday gains, holds onto Monday’s recovery moves.
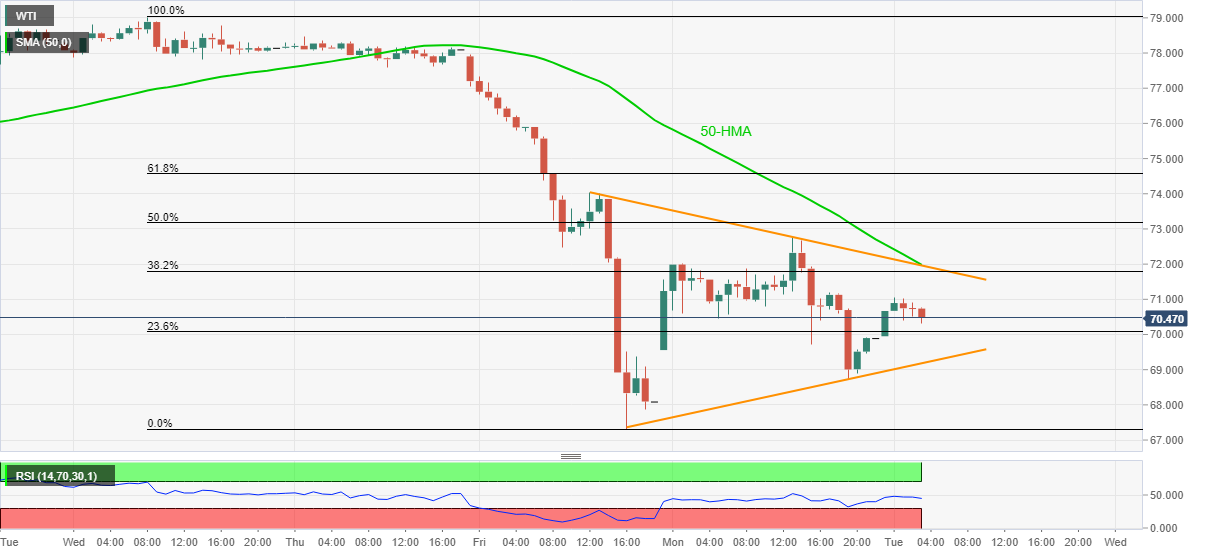
- 50-HMA, triangle resistance restricts immediate upside, RSI retreat teases sellers.
- Bulls need validation from $74.00 even if after crossing triangle’s resistance.
WTI crude oil retreats to $70.40 during a two-day rebound amid early Tuesday. While a two-day-old symmetrical triangle restricts the black gold’s recent moves, RSI pullback and addition of the 50-HMA to upside hurdle keep sellers hopeful.
However, a clear downside break of the stated triangle’s support line, near $69.20 by the press time, becomes necessary for the oil sellers to retake controls.
Following that, Friday’s low near $68.30 will gain the market’s attention before directing WTI bears to September’s low near $67.00 and July’s bottom close to $65.00.
On the flip side, the commodity’s advances will have a tough nut to crack around $72.00, comprising the triangle’s resistance line and 50-HMA.
Even if the quote manages to cross the $72.00, late Friday’s swing high near $74.00 may offer an additional filter before assuring the oil’s run-up towards $77.60, encompassing November 25 upside.
WTI: Hourly chart
Trend: Pullback expected