
Products You May Like
NASDAQ index approaches its 100 day moving average at the lows
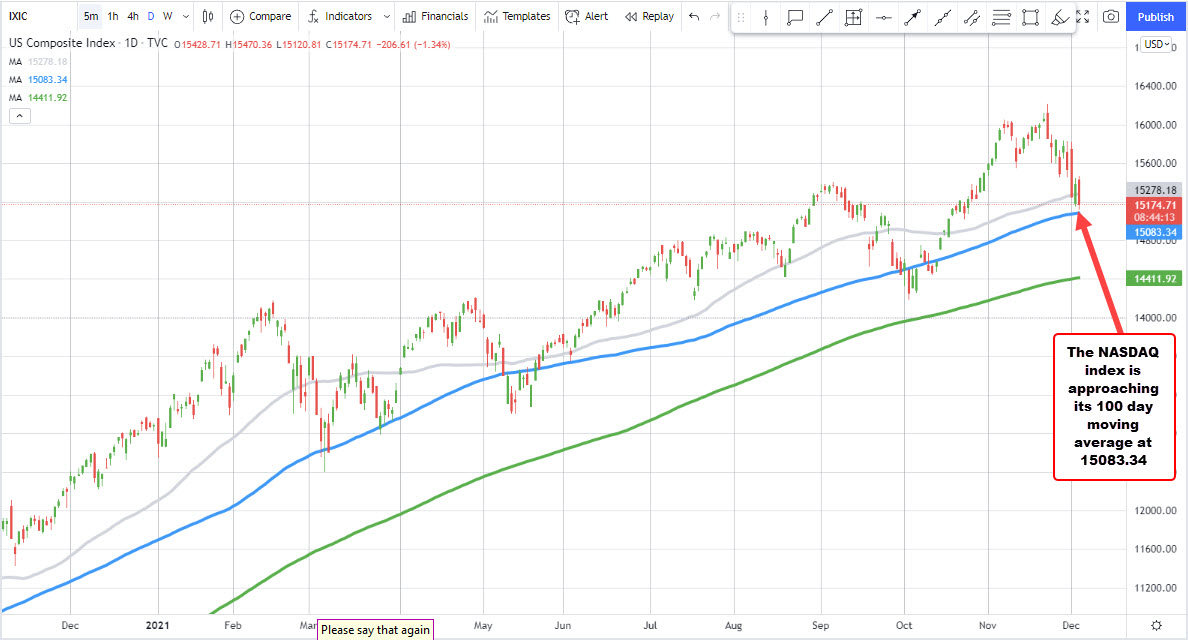
the US stocks have continued to move lower with the NASDAQ index leading the way to the downside. That index is currently down -1.26% at 15189. The low price did reach 15120.81.
Looking at the daily chart, the index is back below its 50 day moving average at 15278.18 (risk for sellers looking for more downside now), and approached its 100 day moving average at 15083.34.
Back at the end of September/ early October, the price fell below the 100 day moving average (closed below that moving average on 7 days between the end of September and October 13), but recovered and moved higher. At the lows today, the index has down -6.73% from its all-time high reached in November.
A move below the 100 day moving average would increase the bearish bias from a technical perspective.
The Dow industrial average is down -0.22%. The S&P index is down -0.55%. The Russell 2000 is down -1.13%