Products You May Like
- NZD/USD bears are holding off the bulls and the daily support structure could come under pressure.
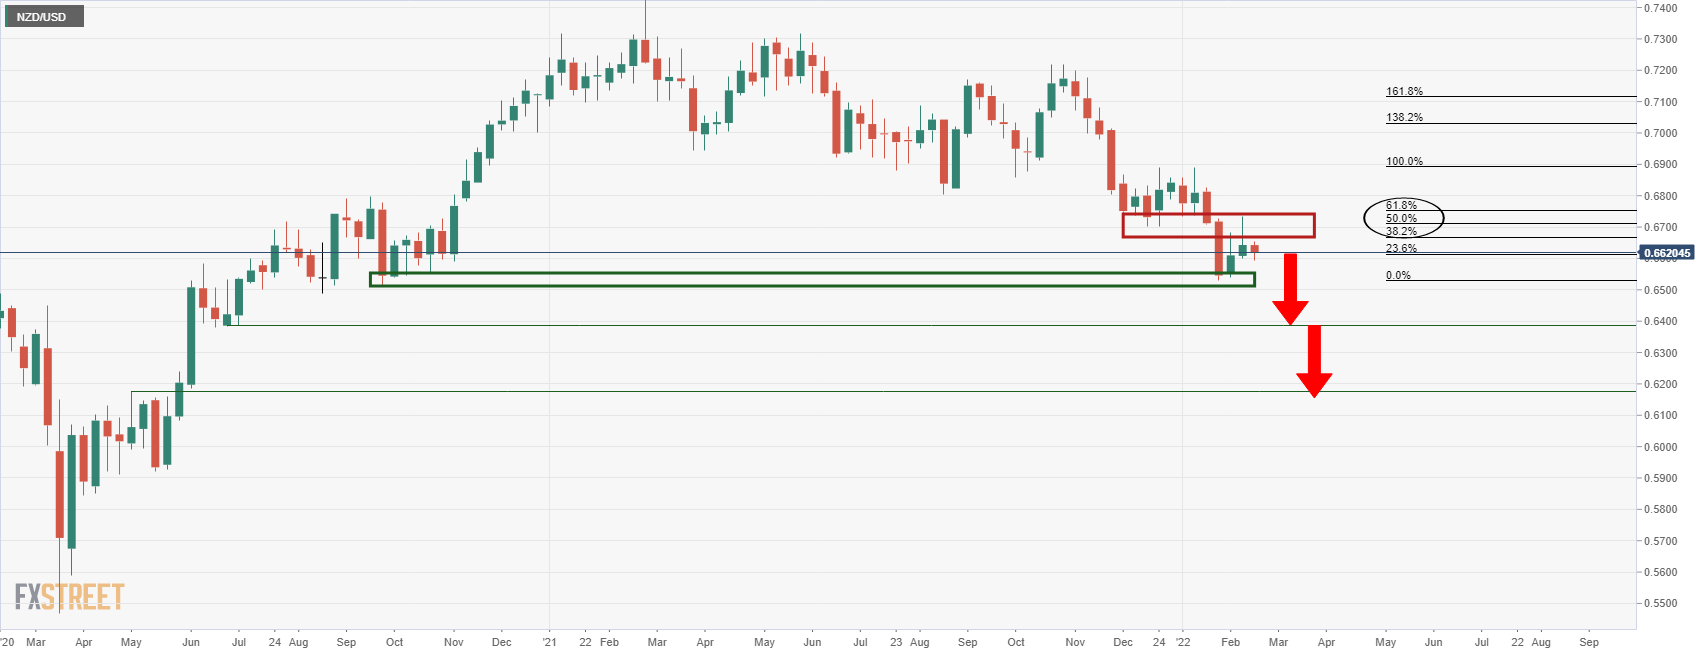
- The weekly chart is weighed with a bearish bias.
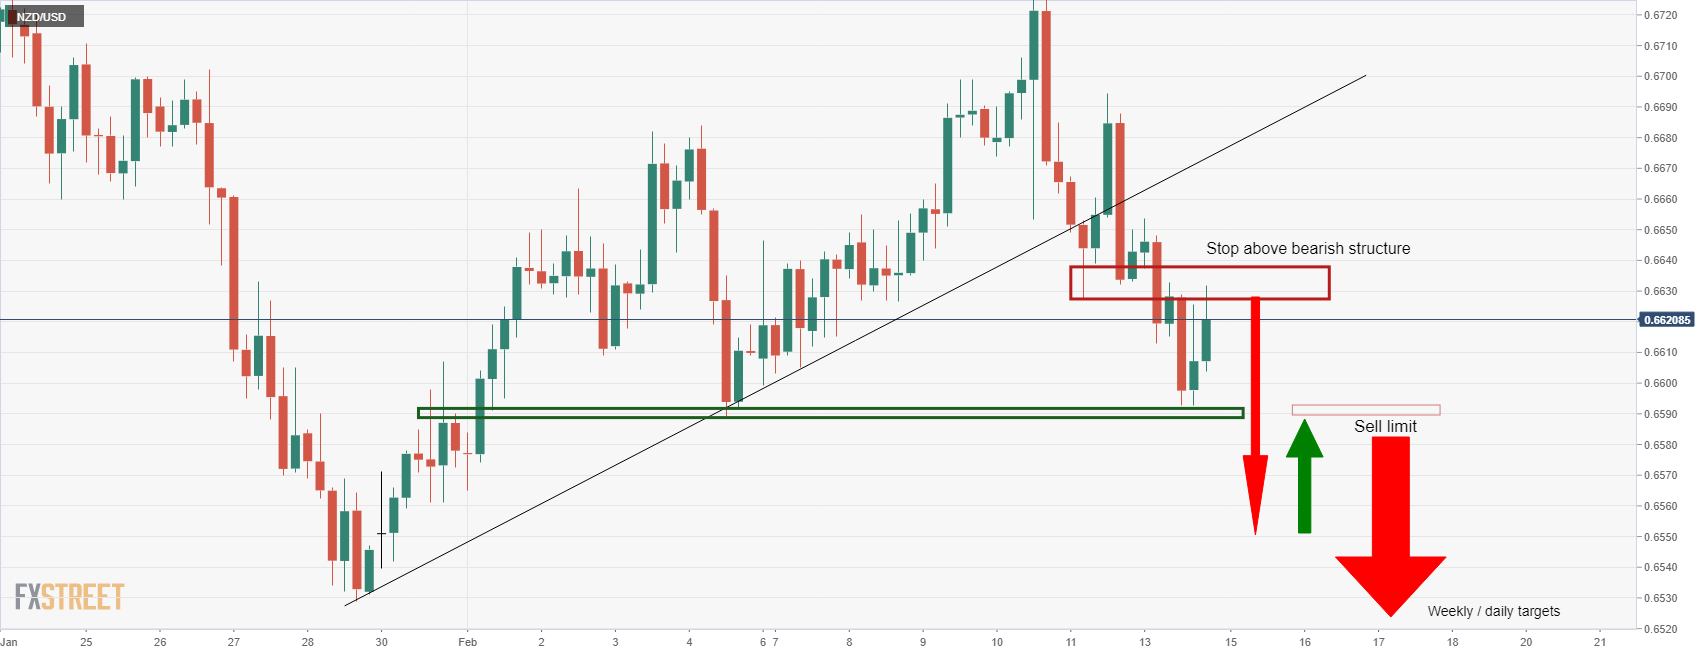
As per the prior day’s analysis, NZD/USD Price Analysis: Bears could move in for the kill at any moment according to H4 structure, the price is respecting the prior 4-hour lows as resistance but the daily support structure is menacing.
NZD/USD H4 chart, prior analysis
It was stated in the New York session that the ”bears will be encouraged by a break of daily support at 0.6589 and might engage fully from there on the restest of the structure.” The chart above illustrates that ”this would be expected to act as a firm resistance and ultimately lead to a downside continuation of the weekly chart’s bear trend,” as follows:

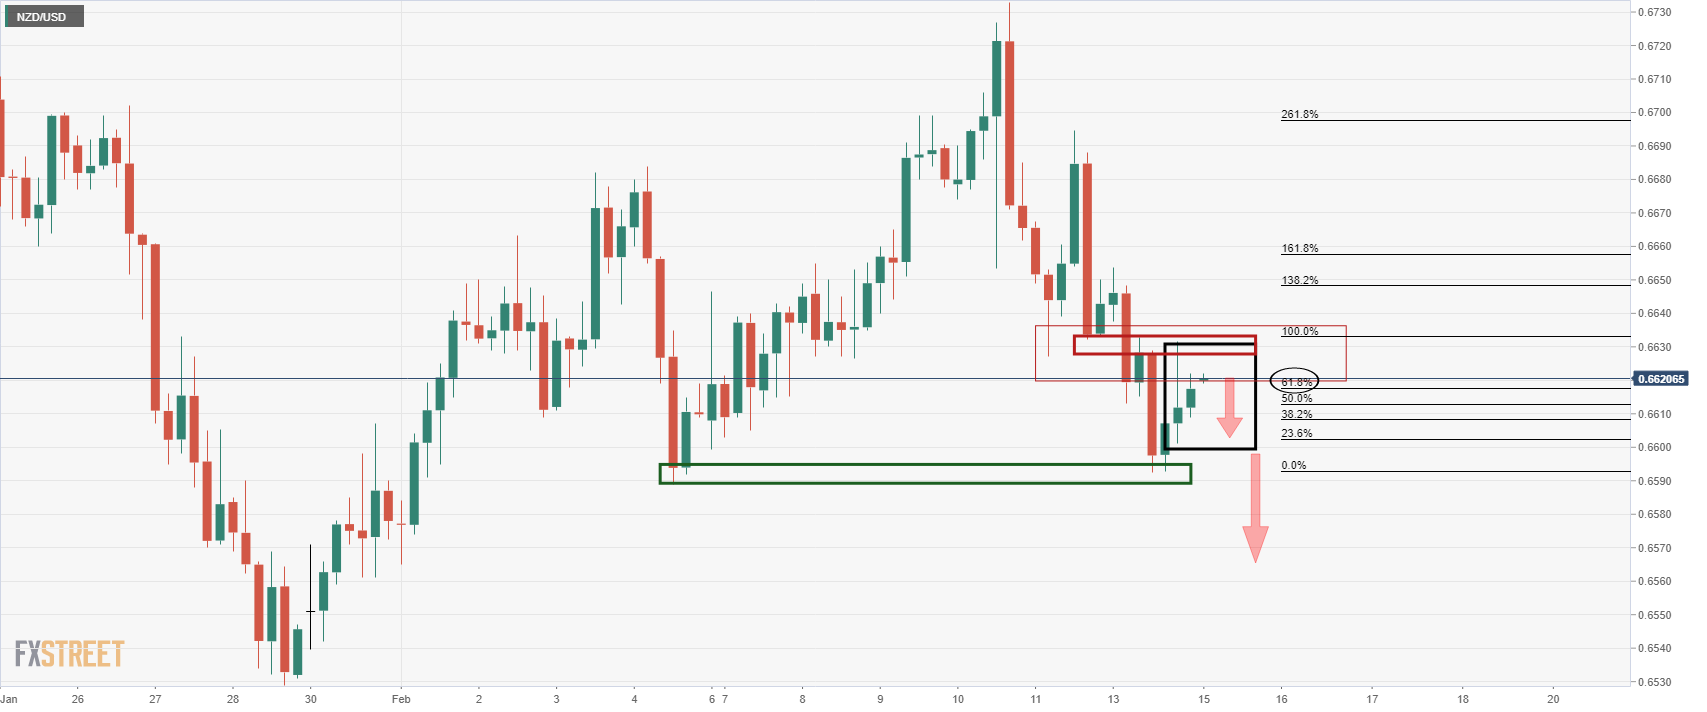
NZD/USD live market
The price has been creeping in on the old support turned to resistance and the 61.8% golden ratio appears to be doing a good job of containing the price, so far. Should the bears commit at this juncture, the daily support structure near 0.6590 will come under pressure, again, and could give way on the third attempt for a breakout.


