Products You May Like
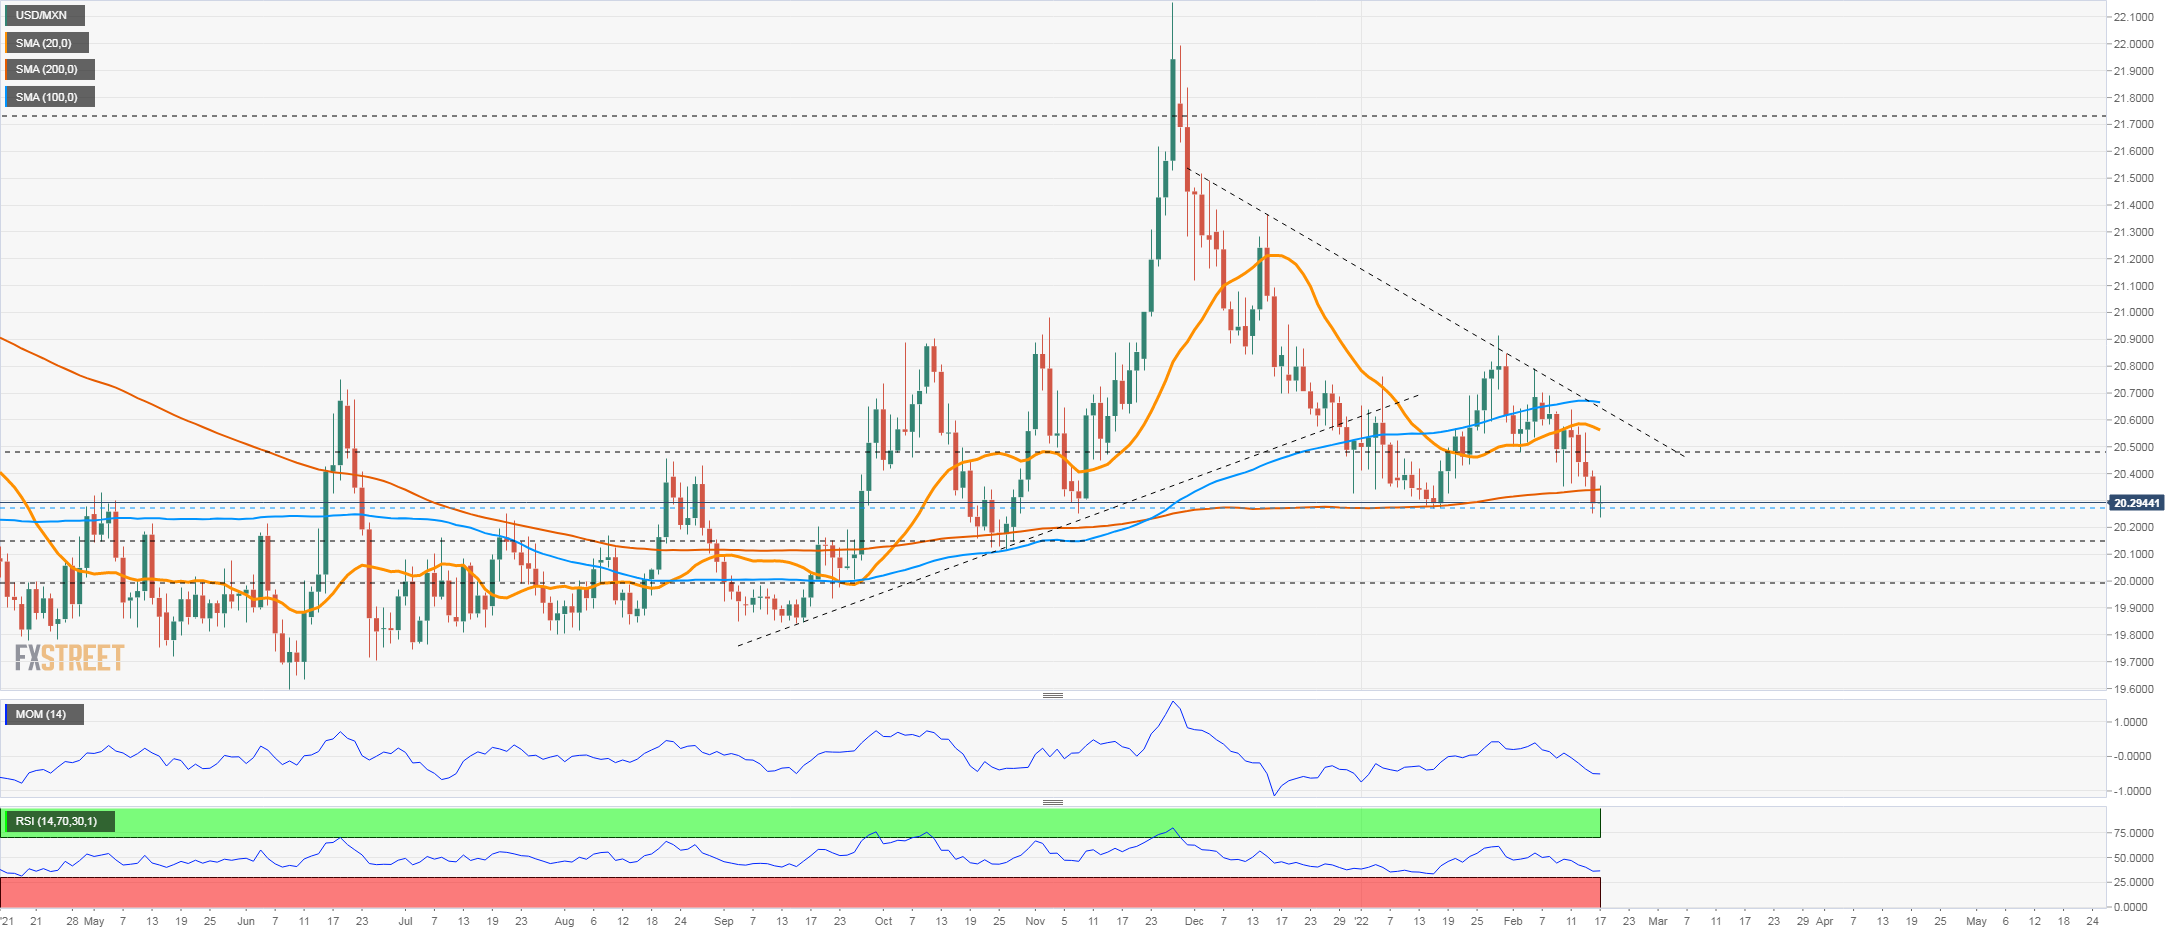
- USD/MXN drops below the 200-day SMA.
- Outlook favor the downside, price to face strong support at 20.30 and 20.05.
- Any recovery of the dollar under 20.70, likely to be unstable.
The USD/MXN posted on Wednesday the first daily close in months below the 200-day moving average and slightly under the 20.30 level. The 20.35/30 area was a strong barrier and while the cross remains below, more losses are on the table.
The next support stands at 20.15 and below a more relevant emerges at 20.00/05. A recovery of USD/MXN could take the price quickly to 20.45 but it should be seen as a correction. The critical resistance at the moment is seen around 20.70, the confluence of horizontal support, key MA and a downtrend line. A break higher would change the short-term bias from bearish to neutral/bullish.
Technical indicators look bearish. The RSI is approaching 70 and flattening, a potential sign of exhaustion, not necessarily followed by a sharp correction. A consolidation is also possible particularly if USD/MXN rises back above 20.30.
USD/MXN daily chart