
Products You May Like

The GBPUSD is continuing it’s run to the downside. That move lower started in the European session when the price fell below the 200 and 100 bar MAs on the 5 minute chart, shifting the bias back to the downside. The move lower has not really seen any meaningful correction.
The largest correction in looking at the chart above, couldn’t get to the 38.2% retracement level. The 38.2% of the last leg lower comes in at 1.2357. The falling 100 bar MA is at 1.2368. The price low reached 1.2300. If you want to put a toe in the water against a round number, that is a round number, but it will take move above the 38.2% retracement and the falling 100 bar moving average to increase the bullish bias.
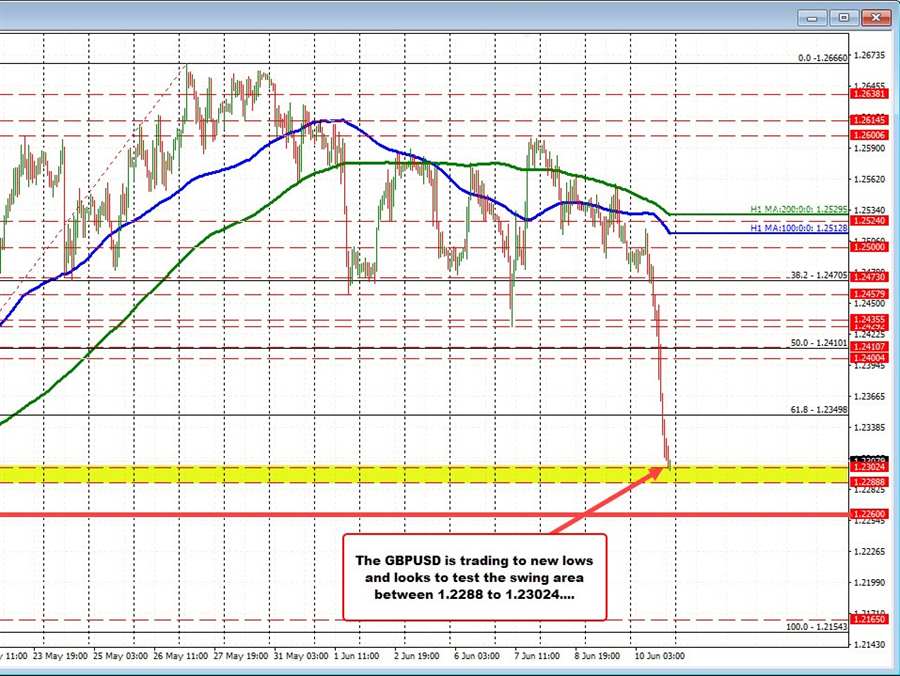
Looking at the hourly chart, the pair is also testing a swing area between 1.2288 and 1.23024. Move below that level puts the pair in the lower extreme with 1.22260 as the next target.

The combination of the round natural number at 1.2300 and the swing area on the hourly chart could be a level to stall against ahead of the weekend, but for the week, the sellers took more control stay below the 200 hour moving average on Wednesday and Thursday. That laid the case for a more bearish bias in today’s run to the downside has paid off for the sellers.