Products You May Like
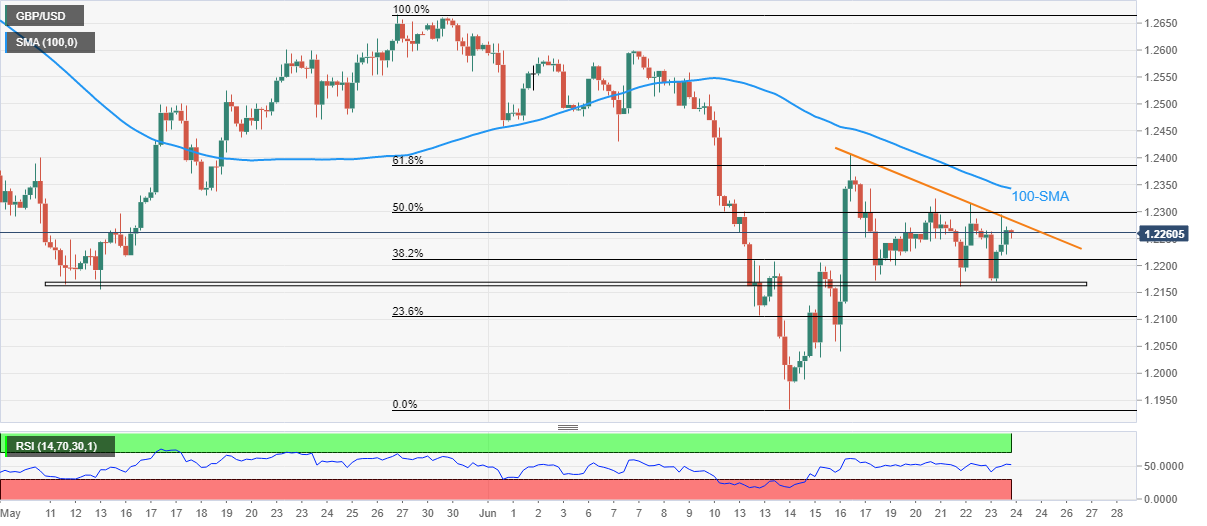
- GBP/USD dribbles inside a bullish chart pattern after two-day inaction.
- Firmer RSI, horizontal support add strength to the bullish bias.
- 100-SMA acts as an extra filter to the north, bears could aim for yearly low on breaking 1.2160.
GBP/USD treads water around 1.2260 during Friday’s Asian morning, following the last two days’ dormancy inside a falling triangle bullish formation.
Adding strength to the Cable pair’s upside bias is the firmer RSI and a six-week-old horizontal support area that also comprises the stated triangle’s lower line.
That said, the GBP/USD buyers need validation from 1.2285 to trigger the upside momentum. Even so, the 100-SMA could test the bulls around 1.2345.
In a case where the quote rises past 1.2345, the previous weekly top surrounding 1.2405 and multiple troughs marked during late May and early June, around 1.2470 could challenge the pair’s further advances.
On the contrary, a downside break of the 1.2160 could quickly fetch the GBP/USD prices towards the 23.6% Fibonacci retracement level of the May-June downside, near 1.2100.
The bearish bias, if persist past 1.2100, won’t hesitate to challenge the yearly low surrounding 1.1933. During the fall, the 1.2000 psychological magnet could offer an intermediate halt.
Overall, GBP/USD is up for consolidating recent losses ahead of the UK Retail Sales for May.
GBP/USD: Four-hour chart
Trend: Further upside expected


