Products You May Like
- USD/JPY gained 1.80% in the week, extending its rally to the seventh consecutive week.
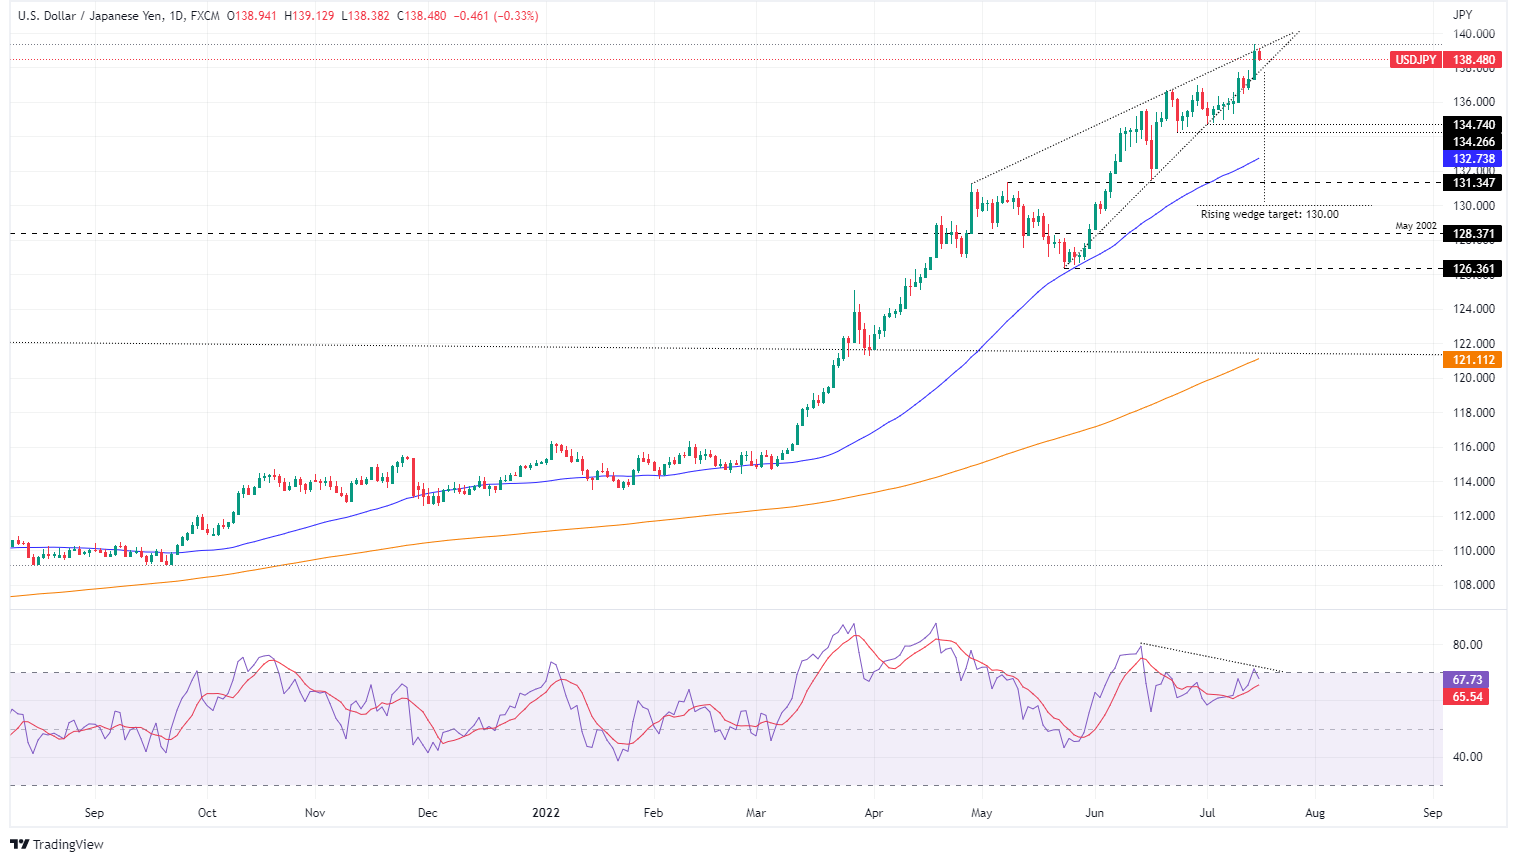
- USD/JPY Price Analysis: Divergence between price action and RSI spurred a pullback, though a daily close below 137.70 would tumble the USD/JPY towards 134.26.
The USD/JPY retreats from YTD highs at around 139.38, towards the middle of the 138.00-139.00 range on Friday, as Wall Street closes the week with gains between 1.83% and 2.15%, underpinned by upbeat data that could deter Federal Reserve members from hiking 100 bps in the July meeting.
The USD/JPY is trading at 138.48, down 0.33% after beginning Friday’s session around the 139.00 figure, nearly daily highs, to then slide to the daily’s central pivot point at 138.54, where the major stabilized, ahead into the weekend.
USD/JPY Price Analysis: Technical outlook
USD/JPY Daily Chart
The USD/JPY remains upward biased, but price action remains overextended. That means that USD/JPY still favors longs, but the Relative Strength Index (RSI) formed a negative divergence and exited from overbought conditions. That said, the USD/JPY could retrace from the YTD highs to its next support level at July 11 high-turned-support at 137.75.
If the above scenario plays out, the USD/JPY next support would be 137.00. The break below will expose the July 1 daily low at 134.74, followed by the June 23 low at 134.26. on the other hand, the USD/JPY’s first resistance would be the 139.00 figure. A breach of the latter would expose the YTD high at 139.38, followed by 140.00.


