Products You May Like
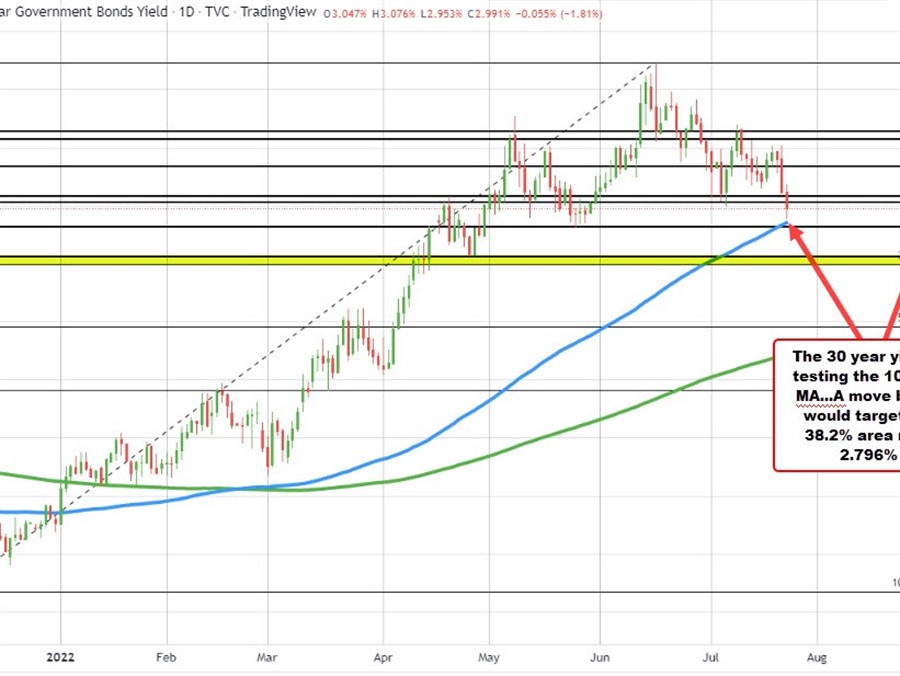
The US 30 year yield is trading back below the 3.0% level for the first time since May 30, moving to a low of 2.953%. The yield reached its week high just yesterday at 3.208%. The high yield for the cycle peaked at 3.493% on June 16.
The service sector PMI data was horrible today indicative of a slowdown not only in manufacturing but services as well. The consumer is feeling the pinch from inflation and they are voting with their wallets. This is actually good news for inflation.
Technically, the yield move to the downside took the yield to the 100 day MA at 2.94%. That level has stalled the fall and led to a modest bounce higher.
However, it increases the levels importance for traders going forward…Stay above, and yields can fight getting back above 3.00% and stay above. Move below and a move toward 2.926% and the 38.2% of the move up from the December 2021 low at 2.796 would be targeted.
The decline in yields are reflected in lower commodity prices:
- Wheat is trading near the lowest levels since February 2022 near 765. The high in 2022 reached 1363.4
- Corn is trading at a new low for 2022 and at the lowest level since November 30, 2021 at 566.0. The high reached 824.4
- Soybean futures are trading at a new low for the year and lowest level since December 17, 2021. The high in 2022 reached 1784
- Copper futures reached the lowest level since November 2020 earlier this month at $3.13. The price is back up to $3.36 currently but well below the 2022 high at $5.03
- Crude oil traded to a July low at $90.54 and trades currently at $96.14. The high reached near $130 in 2022.
The service PMI moving lower may be a reflection of consumers saying “you raised price to levels that don’t make sense anymore”.
I know for me, going and getting a pizza and a couple of craft beers is near $50 with tip included. Add a movie and consumer might be shifting back toward “watching Netflix and chilling” again on date night.
The invisible hand is kicking in and that may lead to not only will inflation leveling, but perhaps some of the inflated increases, will be pulled back.
I think that would be a good thing. “Fast market conditions” for consumers in prices needs to slow and settle back down..It is also good for a tight labor market. Hiring for hiring sake is not good either.
Now if car prices (new and used) can work through their problems. I still drive by the Toyota lot an the lot is near empty. Housing and rents are in the process of slowing and is probably the focus of the Fed.
Does it change the Fed?
The Fed is focused on getting THEIR rates to more normal and above normal levels. That will put them in a position to go both ways. So they will likely go by another 75 basis points and follow with 25 into year end (if trends lower in prices continue).
That will allow them to either go higher, lower or even stay steady in 2023.
PS. the current average for gas is down to $4.413. That is down from a cycle high at $5.016 (-$0.60). A year ago the price was at $3.159 (up $1.26 – up 39.8%).
A year ago crude oil was at $72. At $96 it is up $24 (up 31.5%) on the year but off $34 from the high.
Back of the envelop calculations, the price at the pump should be around $4.12 which is still high but better than $5.01.
Below is a graph of a gallon of regular gas. It was at at $2.57 near the start of the Biden administration in January 2020 (up 71.5%). Crude oil was near $59 (up 62.7%). If the relation remains constant, it implies $4.19 a gallon which is close to the other estimate from above at $4.12.

