Products You May Like
- Gold is on the verge of a downside correction following today’s 2-year auction and recovery in yields.
- Gold bulls are eyeing a deeper correction on the daily chart.
- The Fed is the theme with US data taking the front seat in markets.
The gold price rallied on Tuesday following US data that proves the Federal Reserve’s tactics could be going to plan in trying to rein in higher inflation in the US economy. At the time of writing, the yellow metal is trading at $1,747.50, 0.67% higher after rallying from a low of $1,730.90 to a high of $1,754.11.
The drop in the US dollar and yields helped the precious metal recover a lot of ground to the upside at the start of the New York day after a report showed US private sector activity contracted for a second-straight month in August. The data was the nail in the coffin for the greenback that had already started to flutter as investors started to trim long positions in anticipation of risk events that include the Jackson Hole as the showdown for the week.
Given a data-dependent Fed, markets will be cautious being too long of the greenback into such data as today’s S&P Global flash composite purchasing managers index (PMI), tomorrow’s Durable Goods Orders and Thursday’s Gross Domestic Product, Initial Jobless Claims and Personal Consumption Expenditures. For instance, today’s miss in the flash composite purchasing managers index (PMI) has raised the prospects the Federal Reserve will ease its rate hiking cycle. The data is showing exactly what the Fed is trying to achieve with its stiffest run of interest rate increases since the 1980s — a drop in demand which can help to tame the risks of rising inflation.
The S&P Global flash composite purchasing managers index (PMI) for August dropped to 45 this month, the lowest since February 2021, as demand for services and manufacturing weakened in the face of inflation and tighter financial conditions. A reading below 50 indicates a contraction in activity. If we see more of the same from the forthcoming data this week ahead of the Jackson Hole, then the US dollar may continue to struggle in the face of a cooling demand-side economy.
The Fed has hiked rates from near zero in March to their current range of 2.25% to 2.50%, with more expected in the months ahead, as it tries to tame inflation, which is running near a 40-year high. However, while WIRP suggests a 50 bp hike is fully priced in for the September 20-21 FOMC meeting, the odds of a 75 bp hike could start to dwindle and weigh on the greenback, reviving the bull’s hopes for the higher gold prices.
Nevertheless, analysts at TD Securities argued that with regards to the Jackson Hole, the analysts suggest that the Fed’s Chair, Jerome Powell’s speech ”will likely aim to reinforce the message that multiple, sizable hikes are still in the pipeline, and easing should not be expected to be on the horizon anytime soon.”
”This fits with the recent easing in market expectations for rate cuts to immediately follow the rate hiking cycle, which we expect will be the focus of Fedspeak in the coming weeks. In this context, we are anticipating a capitulation event in gold driven by the unwind of a bloated position held by a few prop-shops and family offices.”
US treasury auction
Meanwhile, we are seeing a bid back into the greenback and US yields following today’s bullish 2-year Treasury auction.
- High yield 3.307%.
- Tail 1.4 bps vs a 6-month average of -0.3 bps.
- Bid to cover 2.49X vs 6-month avg of 2.59X.
- Dealers 23% vs a 6-month average of 17.4%.
- Directs 17.3 vs a 6-month average of 22.2%.
- Indirects 59.7% vs a 6-month average of 60.4%.
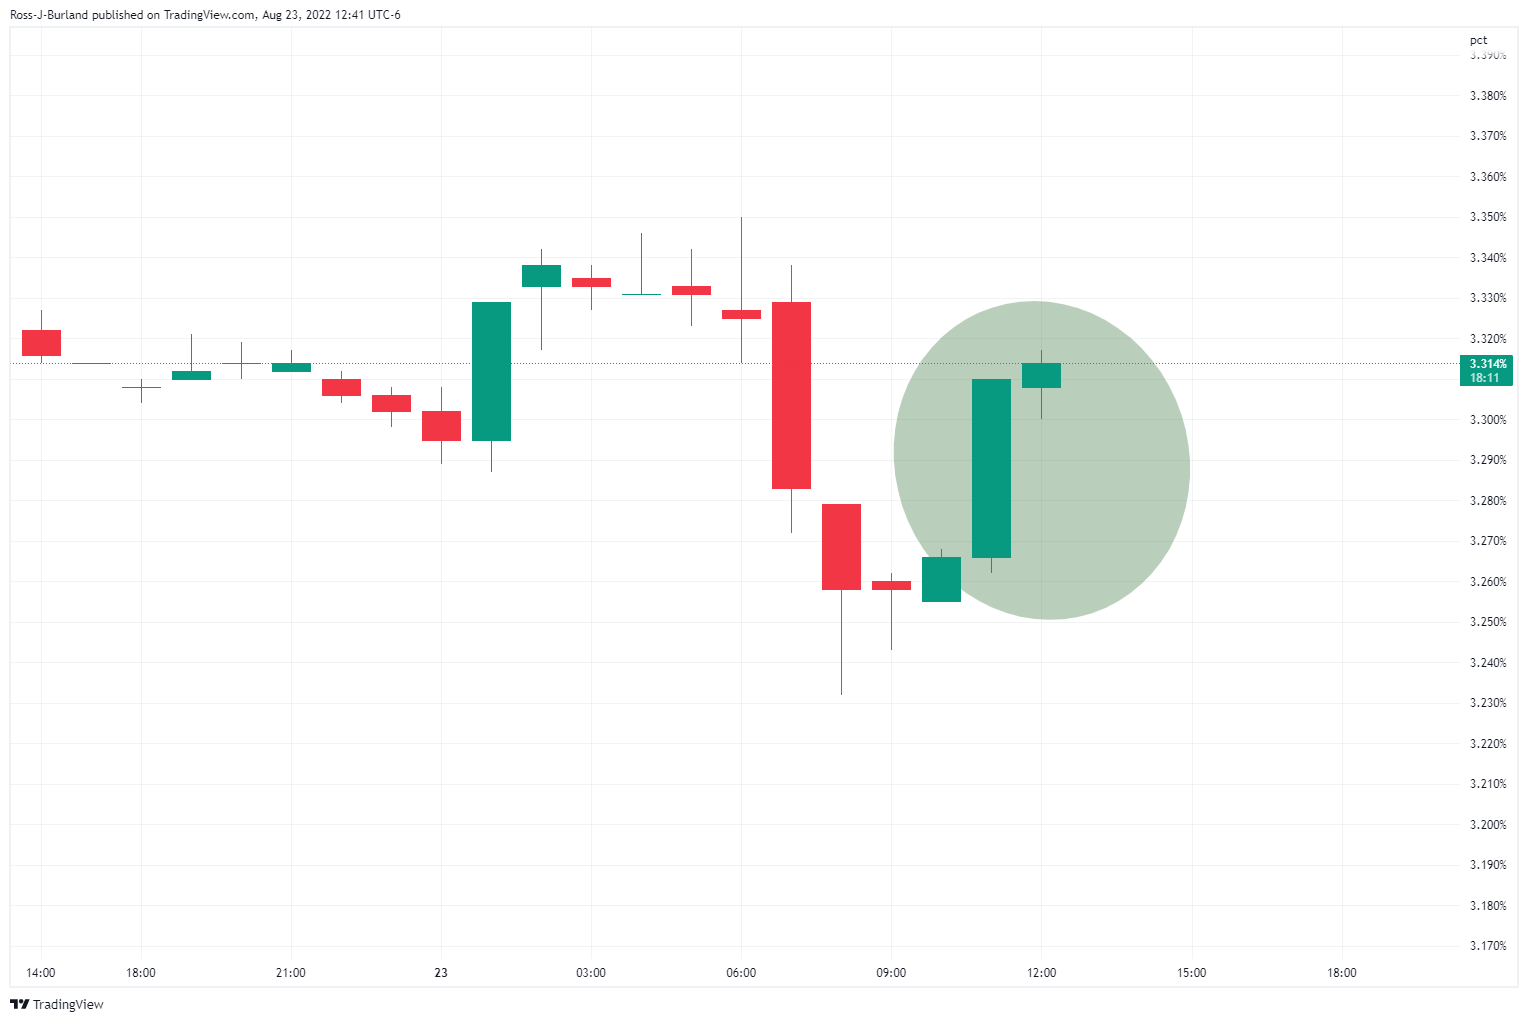
The demand from domestic and international buyers is far below a 6-month average which has seen the 2 and 10-year yields rally, supporting the US dollar and weighing on gold prices in the recent hours since the auction.
The 2-year yield, as illustrated above, has recovered significantly following the auction, weighing on gold:
Gold technical analysis
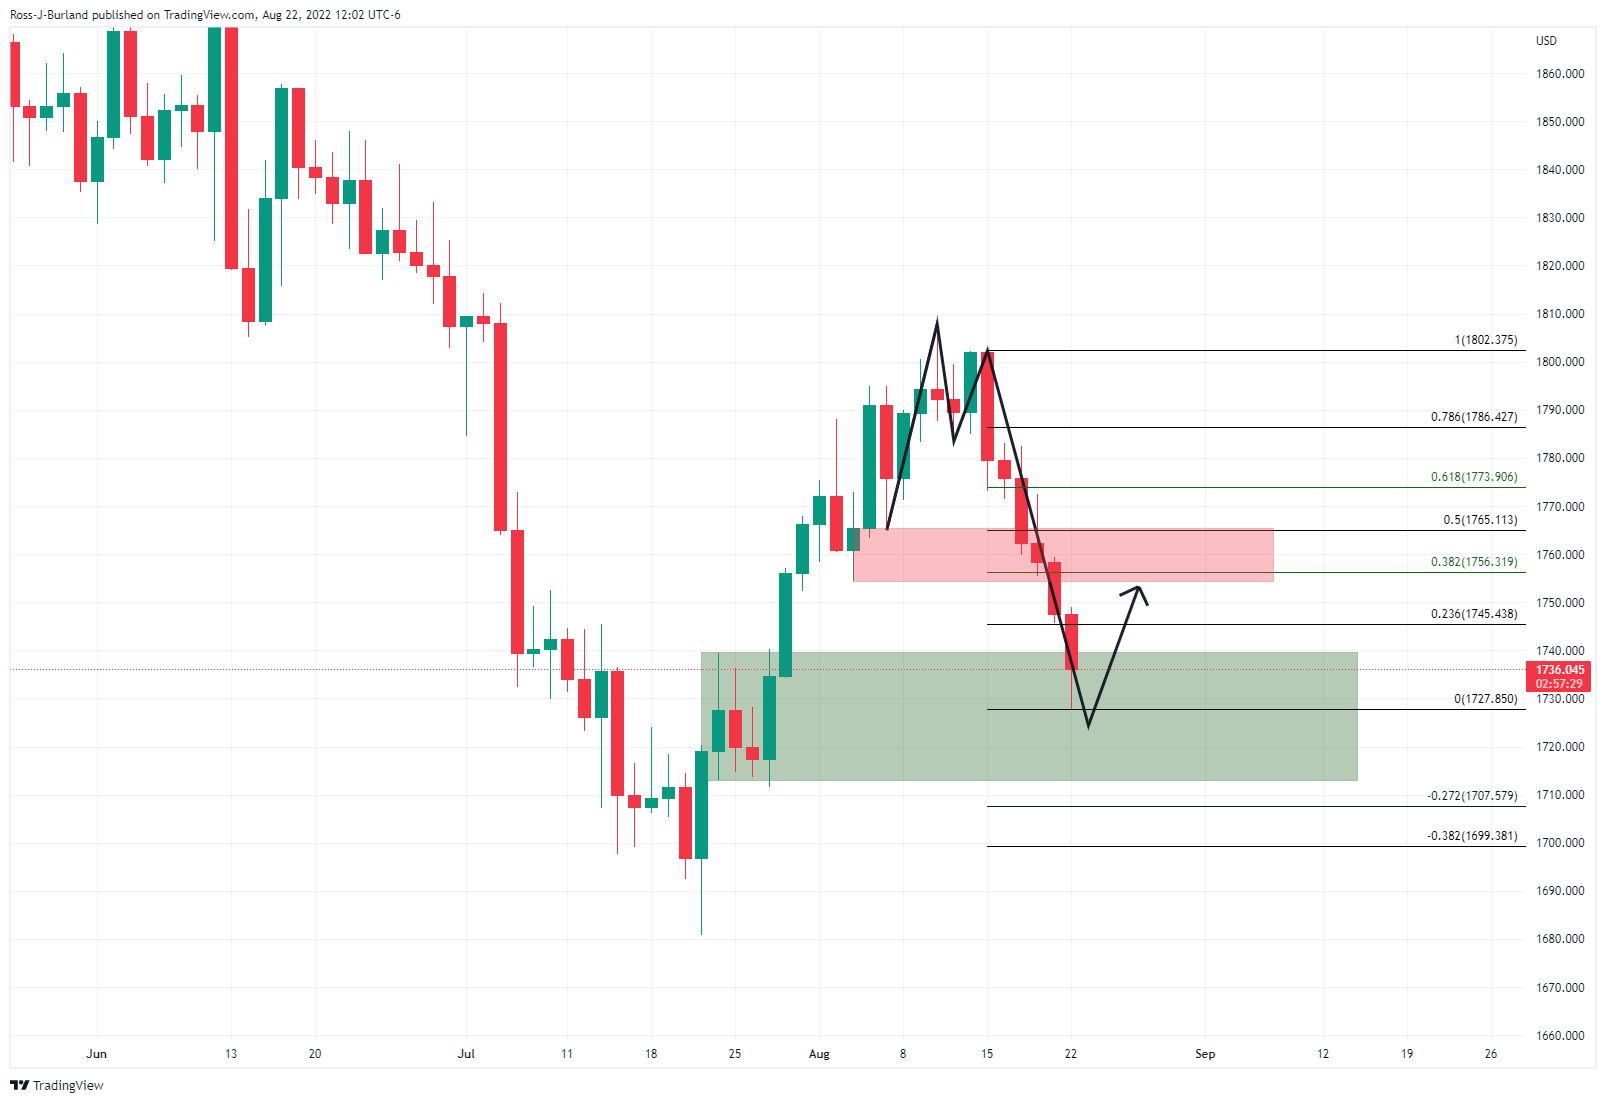
As per the prior analysis, it was stated that the price of gold had left behind an M-formation on the daily chart, a reversion pattern that would be expected to see the price revert towards the neckline in due course. However, it also suggested that given the over-extension of the latest impulse, the correction will more probably only reach as far as the prior support near a 38.2% Fibonacci around $1,755.
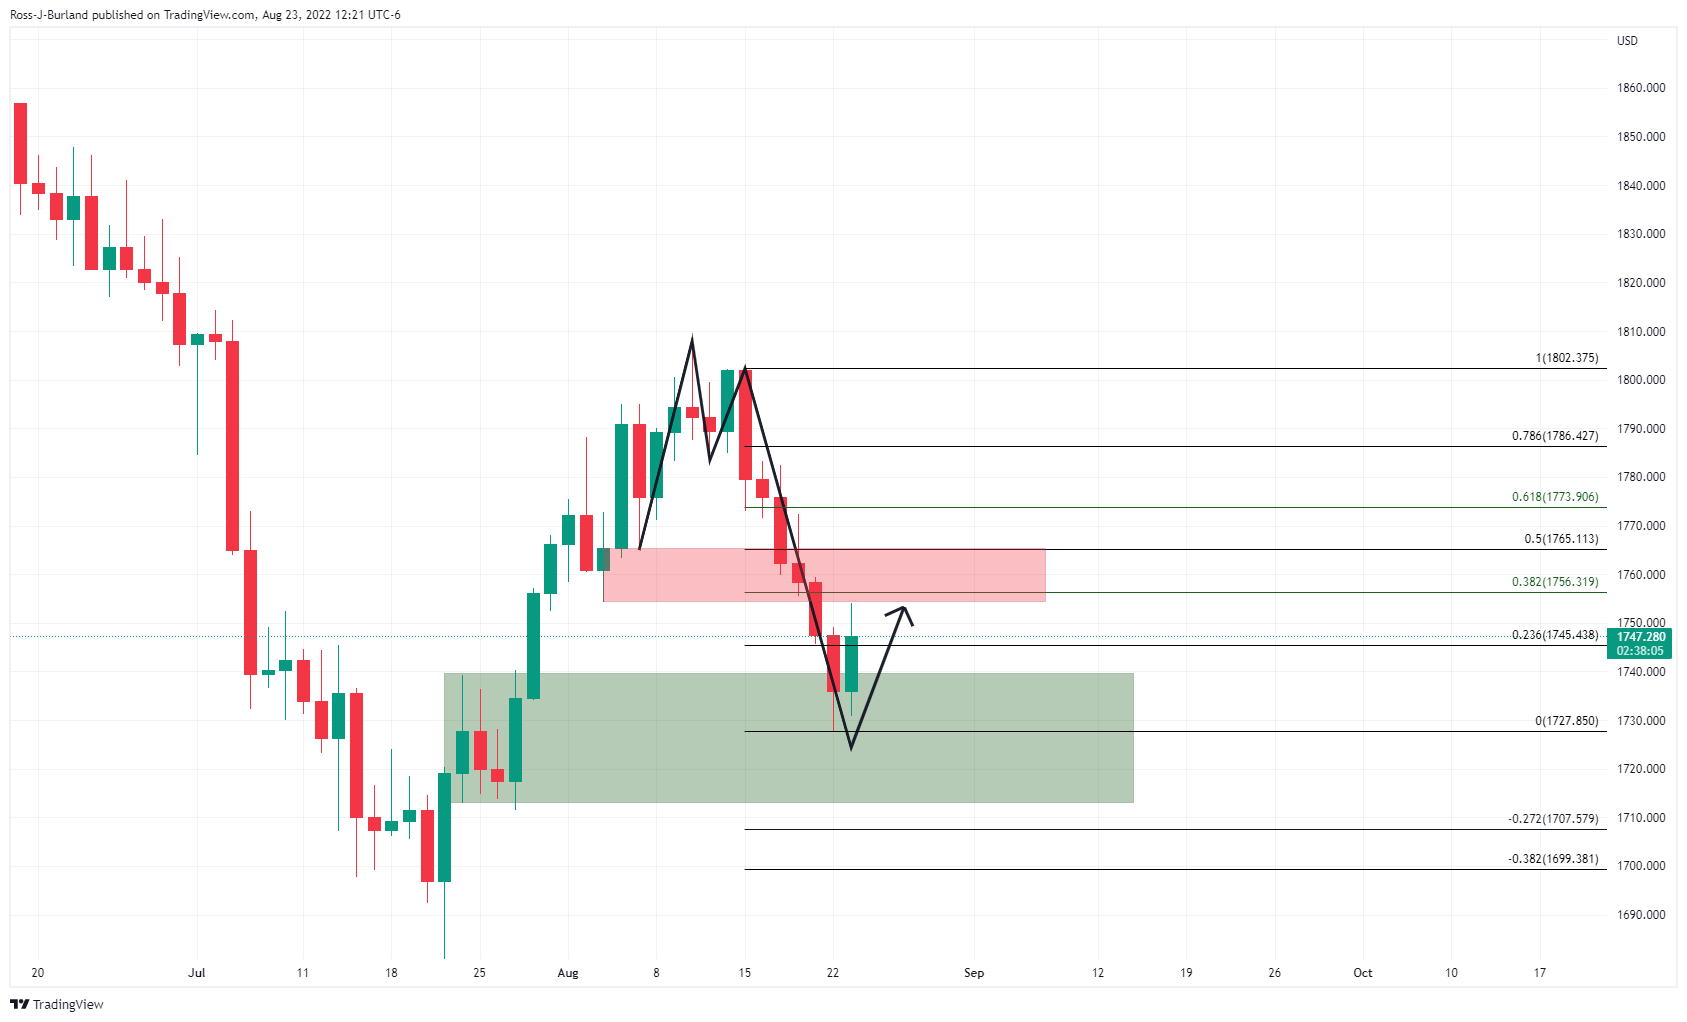
As illustrated, the prior analysis anticipated the correction, above, and the bulls committed to the moves today, below:
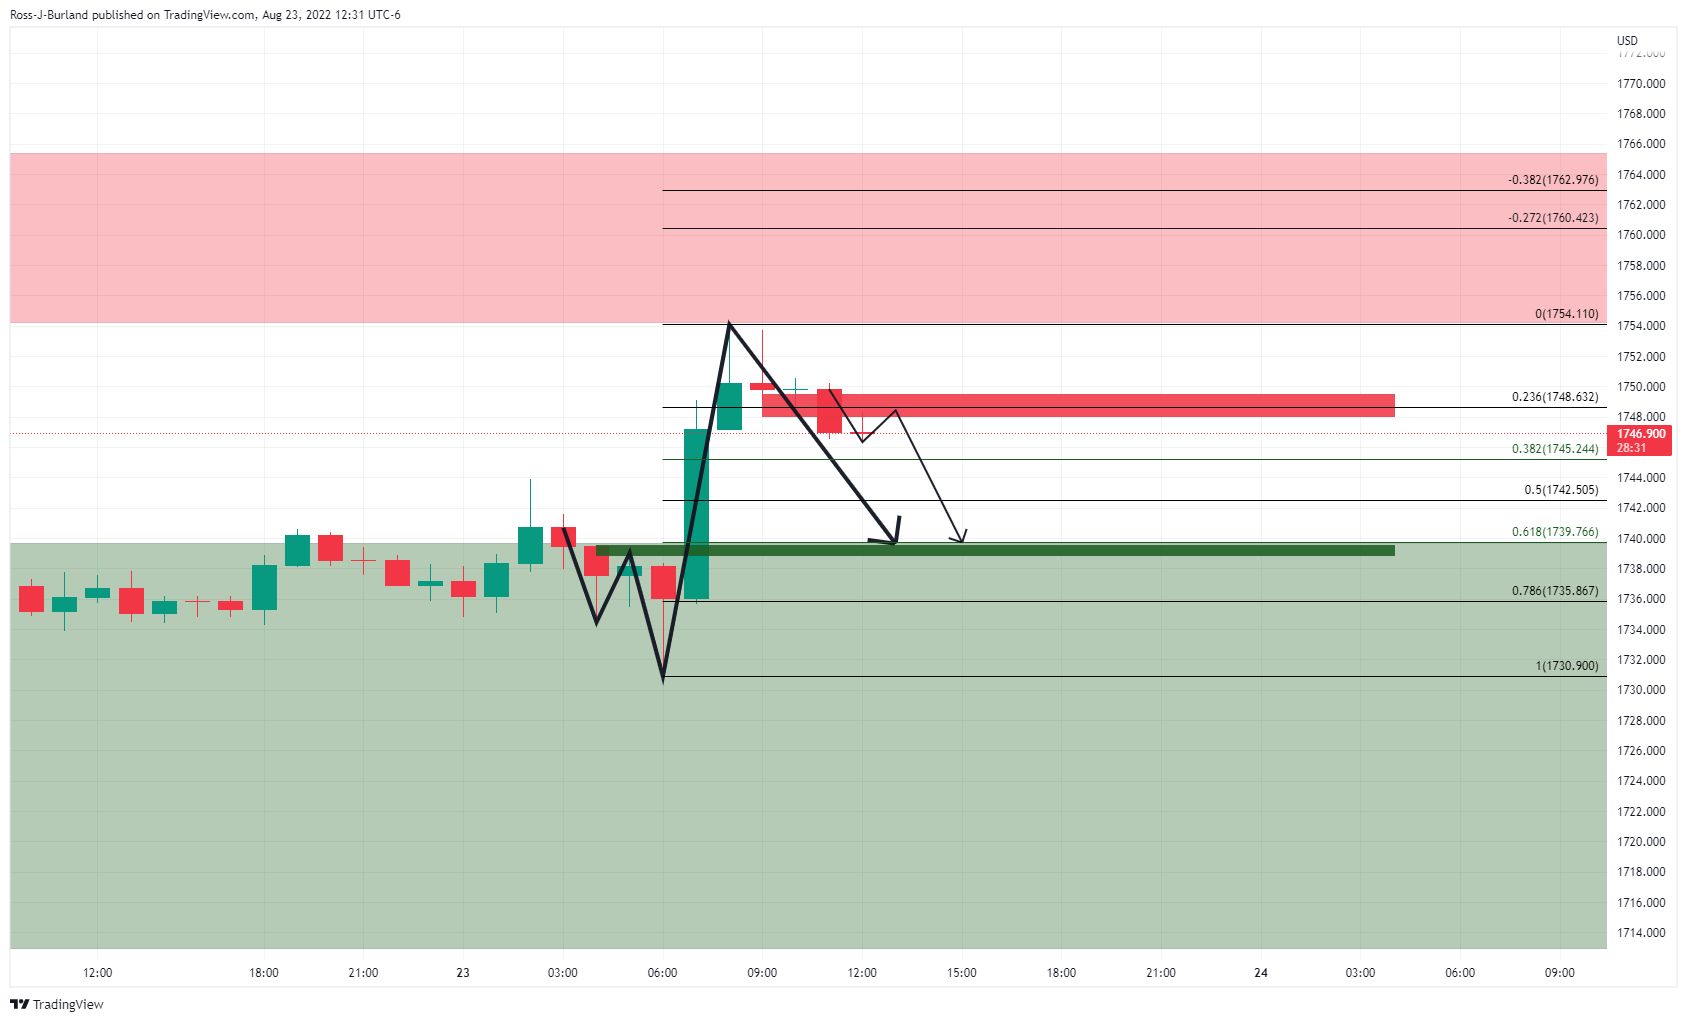
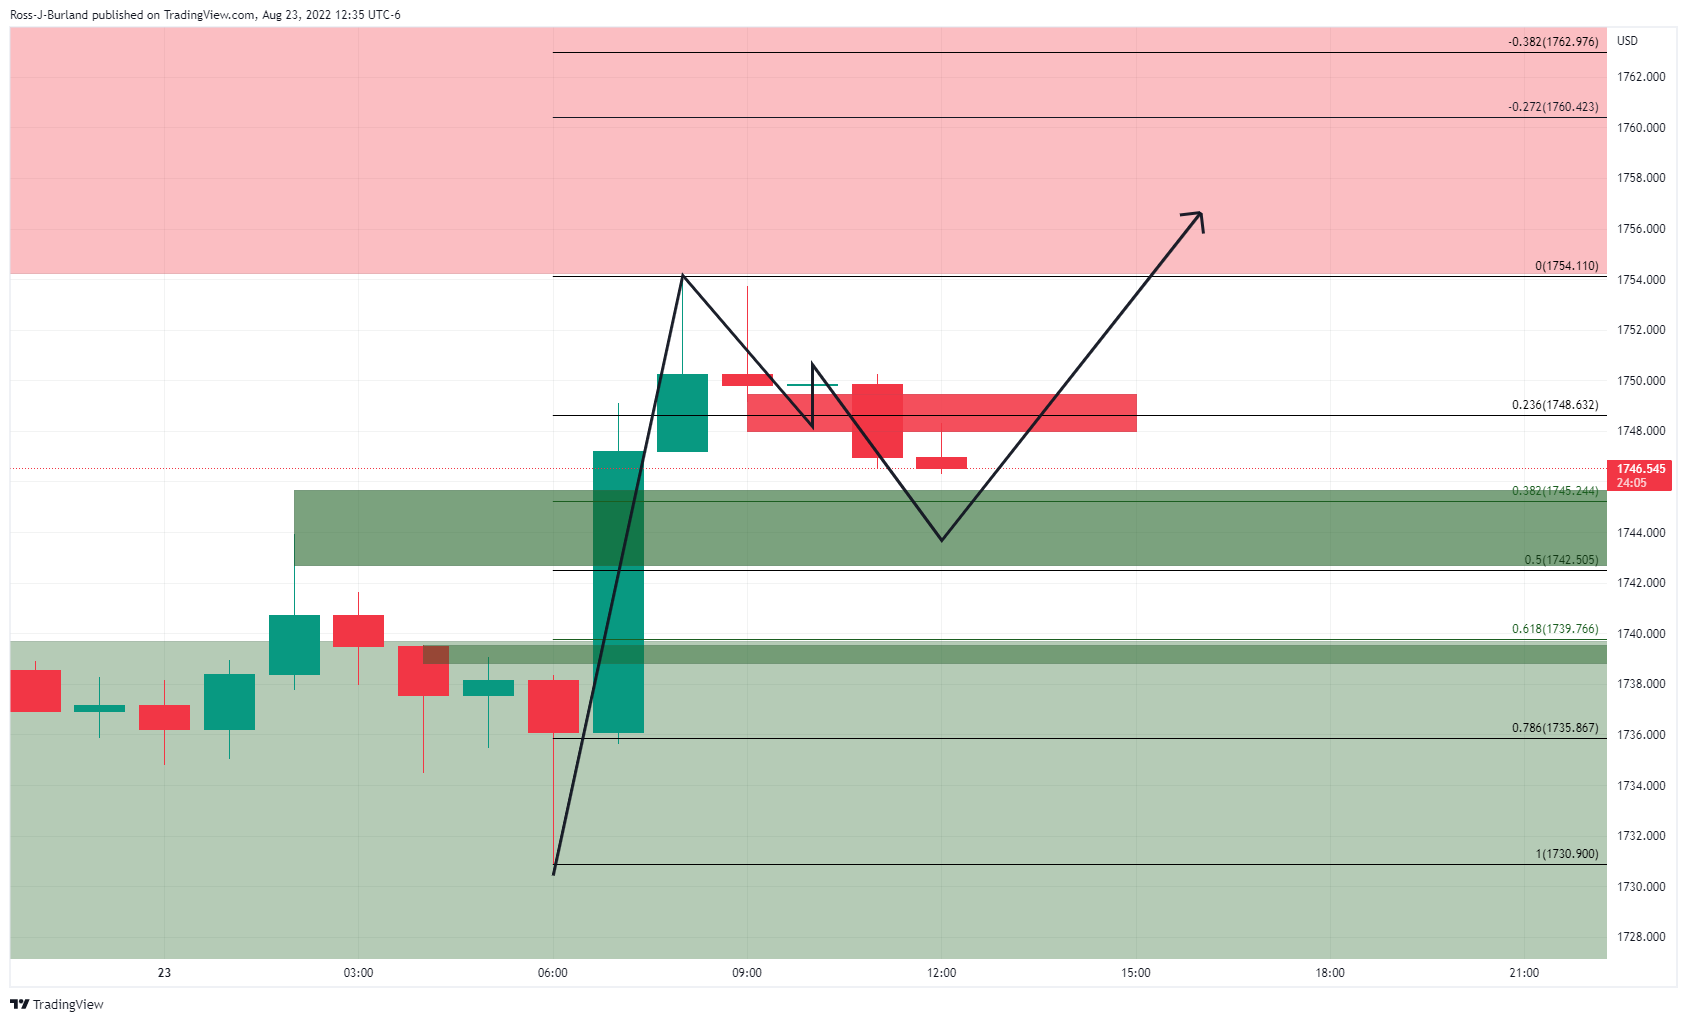
Meanwhile, the price could be on the verge of a significant bearish correction as per the hourly chart:
The W-formation is compelling with the neckline meeting the 61.8% Fibo should the 38.2% and 50% ratios give out. On the other hand, should the 38.2% and 50% hold, given the M-formaiton, the bulls could be encouraged to move in for a deeper correction on the daily chart:


