Products You May Like
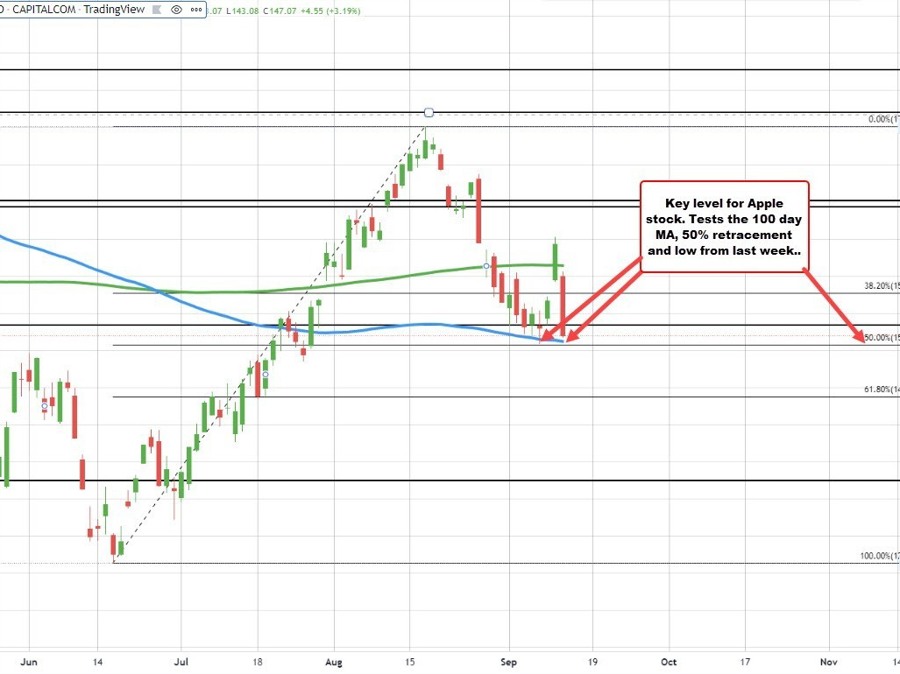
The price of Apple was one of the shining big cap tech stocks from the June low. The low reached 129.05 on June 16. By August 17, the price was back up at 176.12. That was just below the end of year level at 177.59. Yes, the price got within $1.43 of the unchanged for 2022 level. Impressive.
Since then, the price has moved lower and last week the price moved back below the 100 day MA (blue line currently at 152.94). However, momentum could not be sustained and there was a rebound on Friday and yesterday.
Today is a different story and the price is back down about 6% on the day at 153.63.
That has the price back toward the key 100 day MA. Just below that is the 50% midpoint of the move up from the June low at $152.59 (which was near the low from last week too). Break below those levels and that opens the door for more selling. Key level for Apple and the market in general. Apple commands a large influence on the indices. If momemtum increases on the back of a further Apple tumble, that will drag down other indices with it.
In other big caps:
- Meta is trading at 2020 lows.
- Amazon is doing relatively well. It trades above the falling 100 day MA at 122.52 (the stock is at 126.87 currently) The 50% of its move higher is at 123.94.
- Alphabet is skimming the bottoms of 2022. The price is at 104.21. That price is between the lows for the year between $101.88 to $105.05. The 50% of the move up from March 2020 comes in at $100.92

