Products You May Like
- XAG/USD climbed on a risk-on impulse and lowered US T-bond yields.
- US PPI for August tempered inflationary pressures on the producer side.
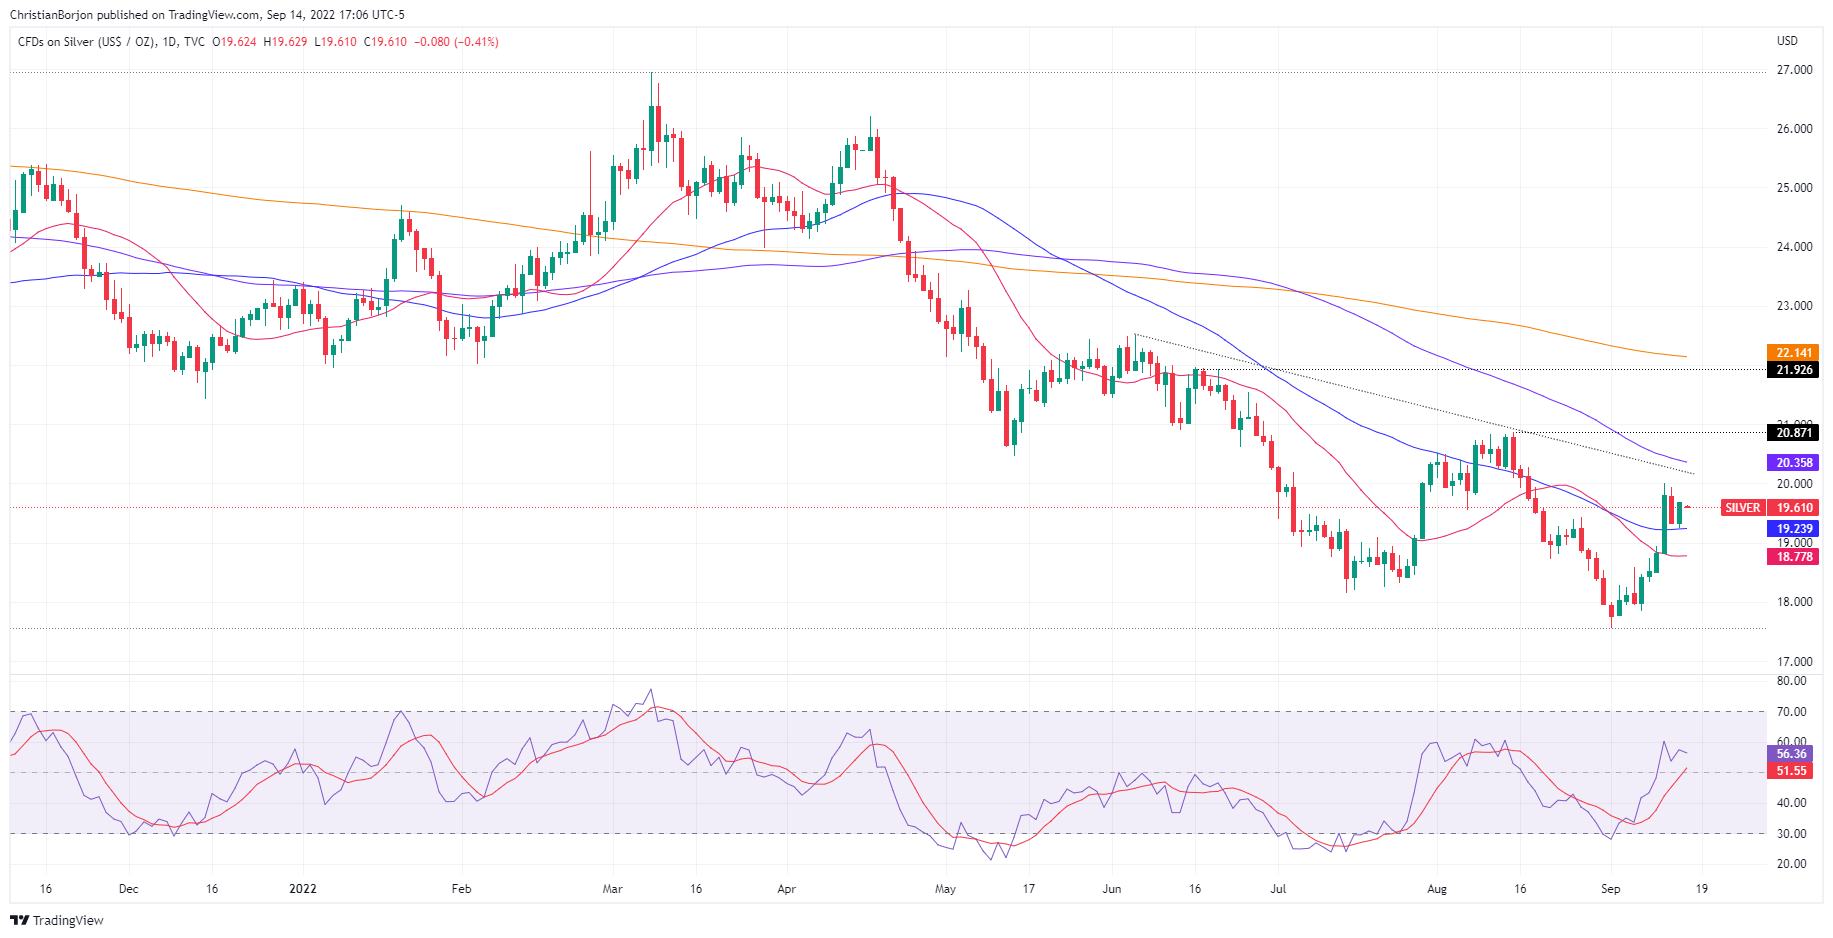
- XAG/USD Price Analysis: Break above $20.00 to send silver towards $21.00 mark.
Silver price rebounds at around the 50-day EMA and climbs towards a daily high near $19.69 on Wednesday after the US Labor Department revealed that August PPI was aligned with expectations easing inflationary pressures on the producer side, contrarily to Tuesday’s CPI.
Therefore, the XAG/USD is trading at $19.61, above its opening price by 1.86%.
Before Wall Street opened, US data revealed by the Bureau of Labour Statistics (BLS) showed that the PPI for August shrank by 0.1%, aligned with the consensus, while the year-over-year figure was down at 8.7%, less than July’s 9.8% report. Meanwhile, the so-called core PPI, which excludes volatile items, edged higher, 0.4% MoM, but on an annual reading, edged up by 7.3%.
In the meantime, the US Dollar Index, a measure of the buck’s value against a basket of six currencies, finished Wednesday’s session down by 0.15%, at 109.648, undermined by US Treasury yields, mainly the 10-year benchmark note rate, unmoved during the day at around 3.404%.
The reflection of the abovementioned is the US Dollar Index, losing some traction, down by 0.09%, below the 110.000 mark. At the same time, the US 10-year benchmark note rate shows signs of exhaustion, flat at around 3.414%.
Another tailwind for the white metal prices was that the US 10-year TIPS, a proxy for real yields, gained only one bps, sitting at 0.939%.
On Thursday, the US economic docket will feature unemployment claims, retail sales, and the New York and Philadelphia Fed Manufacturing Indices, a prelude for October’s ISM report.
Silver Price Analysis (XAG/USD): Technical outlook
The XAG/USD daily chart illustrates the white metal as neutral-to-downward biased. However, if silver buyers reclaim the $20.00 mark, that could pave the way for a test of a four-month-old downslope trendline around $20.20 before reaching the 100-day EMA at $20.39. A breach of the latter will expose the August 15 cycle high at $20.87, ahead of the $21.00 psychological level.


