Products You May Like
- USD/JPY fluctuates around 143.00 amid a negative market sentiment, spurred by recession fears on Fed’s aggressive tightening path.
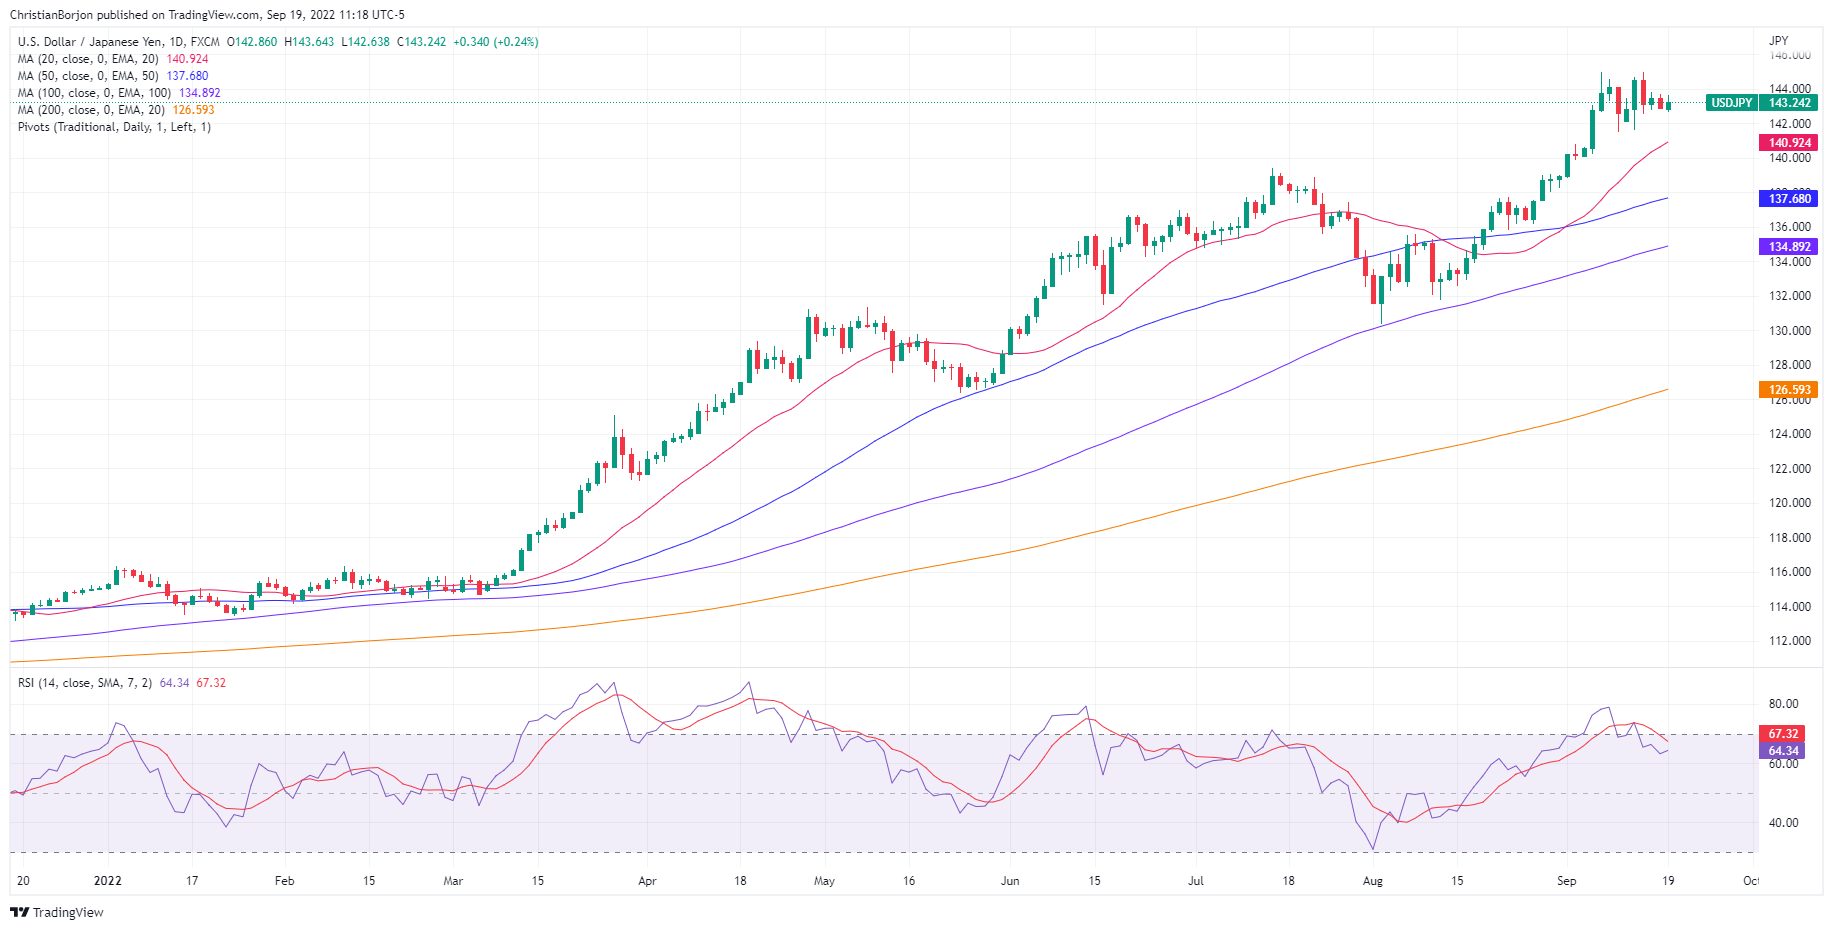
- The USD/JPY daily chart portrays buyers in control, but price action remains constrained.
- Short term, the USD/JPY is range-bound, trapped in the 142.60-143.60 range.
The USD/JPY seesaws around 24-year highs above the 143.00 psychological level, for the third consecutive trading session, amidst a risk-off impulse, courtesy of fears that the Fed’s aggression would likely tip the US economy into a recession. At the time of writing, the USD/JPY is trading at 143.24, above its opening price by 0.24%.
USD/JPY Price Analysis: Technical outlook
The USD/JPY daily chart keeps illustrating that buyers are in charge, albeit price action remains subdued. The daily moving averages (DMAs) reside below the exchange rate, while the Relative Strength Index (RSI) exited from overbought conditions, a respite for US dollar buyers that would like to re-test the USD/JPY year-to-date high at around 145.00. However, it should be noted that once 143.00 gives way, it would pave the way for a fall towards the 20-day EMA at 140.92.
Short term, the four-hour scale depicts the USD/JPY sideways, trapped in the 142.50-143.60 range. Oscillators led by the Relative Strength Index (RSI) is almost flat, hoovering around the 50-midline, displaying that neither buyers nor sellers are committed to opening fresh bets against the rise/fall of the major.
On the upside, the USD/JPY first resistance would be 144.00, ahead of the YTD high at around 144.99. on the flip side, the USD/JPY first support would be the daily pivot at 143.15, followed by the psychological 143.00, ahead of the S1 pivot point at 142.61.


