
Products You May Like
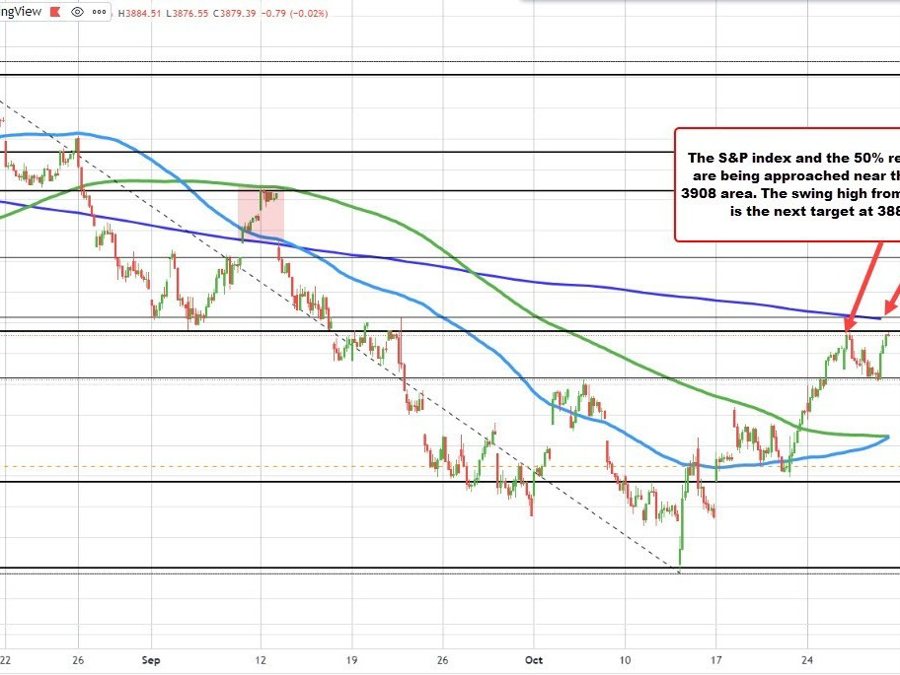
The S&P index is trading to a new session high and in the process is testing the high price from Wednesday’s trade up at 3886.15. The high price just reached 3884.51.
S&P index tests the high from Wednesday
On a move above that level, traders will next target the falling 100 day moving average which currently comes in at 3905.86 (see upper blue line in the chart above). That moving average is also near the 50% retracement of the move down from the August 16 high. Get above both those levels and it opens the door for further upside momentum from a technical perspective.
For the Dow industrial average, it has moved above its 200 day moving average once again at 32642 area. The high price just reached 32759.87. The 50% midpoint of the move down from the January 2022 high comes in at 32806.80.
Dow is above the 200 day MA
The talking head on CNBC is saying that the Dow is on pace for the best October since 1976. That index is up nearly 14% this month.
In contrast, the S&P is up 8.3% and the NASDAQ index is up 4.3%. The small-cap Russell index is up 10.52%.